
Sorting organisations
Sort renewable energy developers, owners, contractors and consultants in RenewMap by project count, capacity, recent activity and milestones, using the Organisations table and advanced search.
Sorting organisations helps you answer questions like “who are the most active developers in NSW?” or “which contractors have built the most operating wind farms?”. Organisations are sorted in the Organisations table, so the order always reflects the filters you have set.
There are two ways to sort organisations:
- Ask advanced search a question such as “most active developers in NSW”. RenewMap sets up the filters and sort for you.
- Set it up yourself by filtering and sorting the Organisations table.
Either way, the sort panel lists the top 10 alongside the map.
Sort with advanced search
- Select the search bar, or press ⌘K (CtrlK on Windows).
- Ask a question that names one role. For example:
- “most active developers in NSW”
- “biggest and most active visual impact consultants in NSW on solar and wind projects”
- “planning consultants with the most projects reaching FID”
- Press Enter ⏎, or select the filter suggestion.
RenewMap then sets field filters and sorting to best answer your search query. Sorts are applied to table columns. The sort panel is opened with a summary of results.
Use Undo next to your active filters to get your previous filters back.
Note: Advanced search must be enabled for your RenewMap account; see What is advanced search?.
Sort with the table
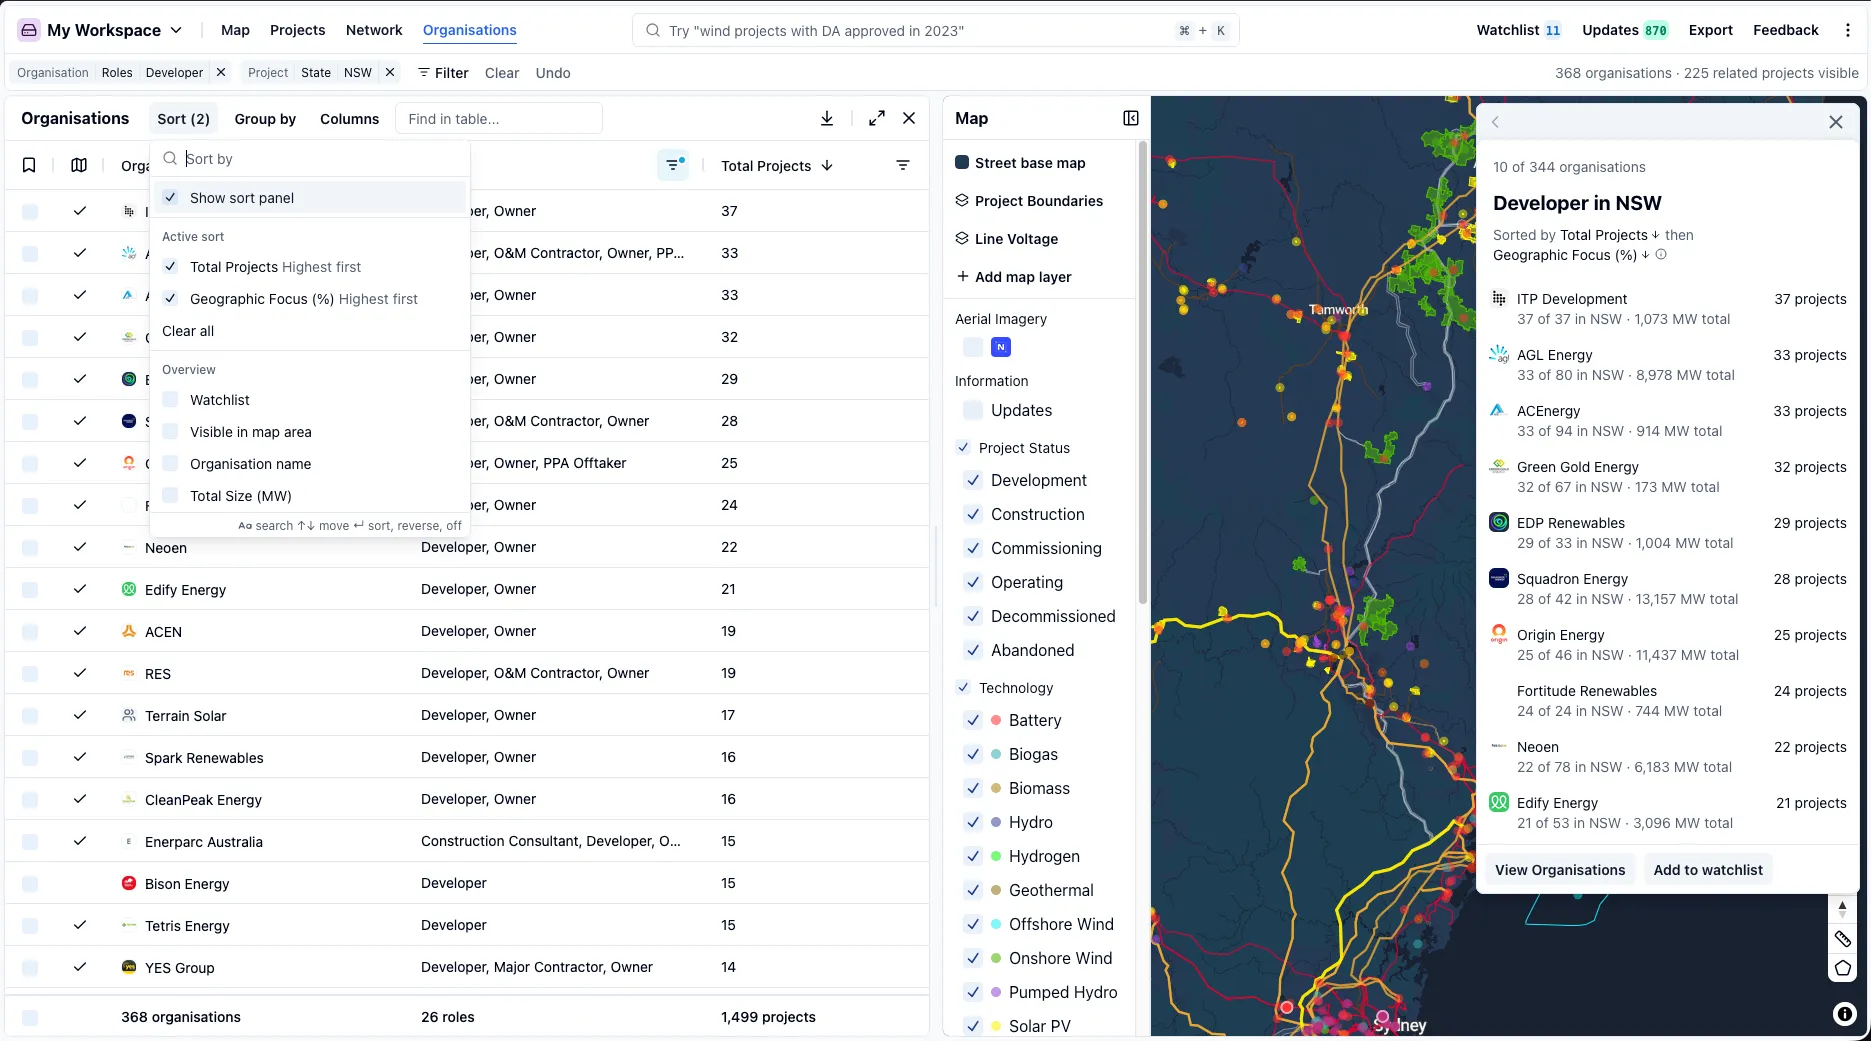
- Select Organisations in the header to open the Organisations table.
- Filter the Roles column to one role, such as Developer.
- Select Sort and choose a column. Select it once for lowest first, twice for Highest first. You can add a second column to break ties. Learn more about sorting the table.
- Optionally, add project filters such as State or Technology. See How filters change the numbers.
The sort panel
The sort panel lists the top 10 organisations from the Organisations table, so you can keep them in view while you explore the map.
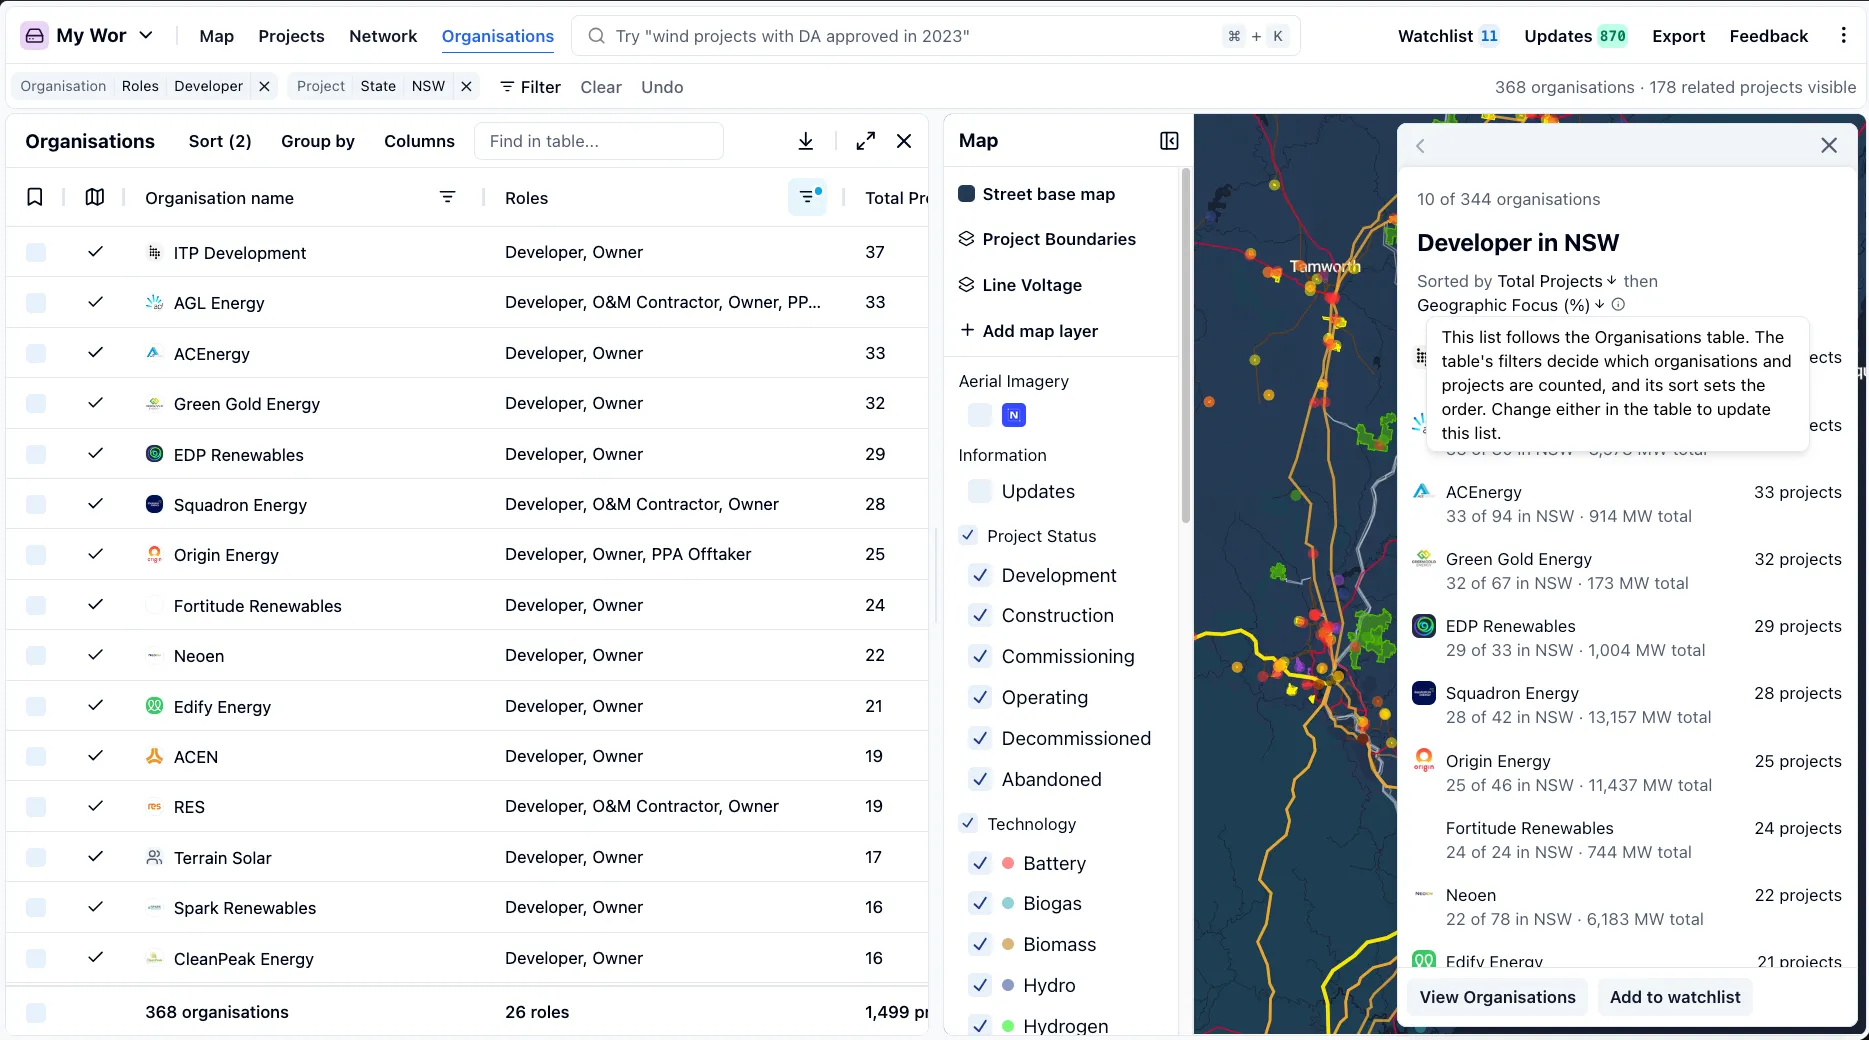
The panel needs a role filter on the Organisations table. To open it, select Sort in the Organisations table toolbar and tick Show sort panel. It also opens when you sort with advanced search. To close it, select the X or untick Show sort panel.
The panel follows the table: the table’s filters decide which organisations and projects are counted, and its sort sets the order.
- Title: the role, and the location if you’ve filtered to one, for example “Developer in NSW”.
- Sorted by: the columns the list is sorted by, or Not sorted.
- Each row: the organisation and the values it’s sorted by. With a location filter, the row also shows how much of its portfolio is there, for example “4 of 9 projects in NSW”.
Only organisations with at least one counted project are listed. Select one to see more details about the organisation.
- View Organisations opens the full Organisations table.
- Add to watchlist adds the listed organisations to your watchlist.
Columns to sort by
Add any of these columns from the Columns button in the Organisations table.
| Column | Description |
|---|---|
| Total Projects | The number of projects an organisation is linked to in any role, excluding projects where it is only a PPA offtaker. |
| Total Size (MW) | The combined capacity, in MW, of the projects an organisation is linked to in any role, excluding projects where it is only a PPA offtaker. It is rounded down to the nearest whole MW. |
| Largest Project (MW) | Capacity of the single largest project this organisation is linked to, in MW. Reflects the active project filters, and when a role filter is applied, only projects where the organisation holds that role. |
| Average Project (MW) | Mean capacity across the projects this organisation is linked to, in MW, rounded down. Reflects the active project filters, and when a role filter is applied, only projects where the organisation holds that role. |
| Project Updates | Number of updates published against this organisation's projects in the last 12 months, as a measure of how actively its portfolio is moving. Reflects the active project filters, and when a role filter is applied, only projects where the organisation holds that role. |
| FID Reached | How many of this organisation's projects have reached Financial Investment Decision. FID is a one-time milestone, so this is a lifetime total rather than a recent-activity measure. Reflects the active project filters, and when a role filter is applied, only projects where the organisation holds that role. |
| Commercial Operations Reached | How many of this organisation's projects have reached Commercial Operations. Like FID, this is a one-time milestone, so the figure is a lifetime total rather than a recent-activity measure. Reflects the active project filters, and when a role filter is applied, only projects where the organisation holds that role. |
| Geographic Focus (%) | Share of this organisation's projects inside the active location filters (state, council area, renewable energy zone), as a percentage of its projects across all locations. Every other filter applies to both, so a high figure means the organisation concentrates there rather than simply having projects there. Shows 100% when no location filter is applied. |
How filters change the numbers
These columns are calculated from the projects you’ve filtered to, so the same organisation can sort differently depending on your view.
- Project filters, such as State, Technology or Project Status, limit which projects are counted. Filter to Solar in Queensland and Total Projects counts only an organisation’s solar projects in Queensland.
- The Roles filter counts only projects where the organisation holds that role. Filter to Developer, and a company that is both a developer and a contractor is counted on its developer projects only.
- Location filters (state, council area, renewable energy zone) drive Geographic Focus (%): the share of an organisation’s projects that are inside your locations. A high figure means it concentrates there, rather than simply having projects there. It shows 100% with no location filter.
Examples
Type any of these questions into advanced search, or set up the filters and sort yourself.
| Question | Roles filter | Other filters | Sort by |
|---|---|---|---|
| Who are the biggest wind developers in Victoria? | Developer | Technology: Wind, State: VIC | Total Size (MW) |
| Which contractors are busiest right now? | Major Contractor | Project Updates | |
| Which owners have the most operating capacity? | Owner | Project Status: Operating | Total Size (MW) |
| Which developers are most focused on Central Highlands REZ? | Developer | State REZ: Central Highlands REZ | Geographic Focus (%) |
| Which turbine OEMs supply the most projects past FID? | Turbine OEM | FID Reached |