
Generation & Load
How RenewMap derives half-hourly Generation and Load (MW) per unit from AEMO's 5-minute operational telemetry, what the numbers include, and how to read them.
Generation is the most basic operational metric for a power station: how much power did it produce?
Units report an instantaneous reading of their output to AEMO roughly every 5 minutes via their real-time control systems. This is the actual output, independent of what the market dispatched it to do.
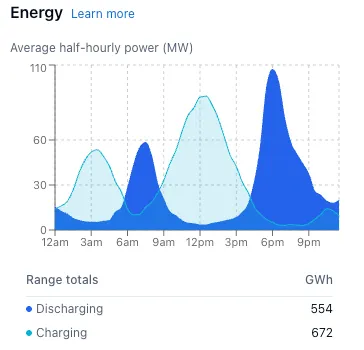
Load is from the same source, but a measure of power consumed rather than produced. Units such as batteries and pumped hydro both inject and withdraw power.
Both metrics are rates, not volumes, i.e. average power output in MW across a period, not average energy generated in MWh. See: Turning MW into MWh.
Where you see it in RenewMap
The Generation chart in a project’s Operational tab, which carries Load as its own series for units that consume as well as produce, the Curtailment map visualisation, and in the api.

| Granularity | 30 minutes, per DUID, summed across a project’s DUIDs |
| Units | MW (average over the period) |
| Series names | generation, load |
| Applies to | Generation: units registered GENERATOR or BIDIRECTIONAL. Load: units registered LOAD or BIDIRECTIONAL |
| Blank when | The unit’s registration doesn’t allow that role; the unit’s dispatch type can’t be resolved for the interval; or no telemetry is published |
A project is not the same thing as a unit. AEMO dispatches DUIDs (Dispatchable Unit Identifiers), and a single RenewMap project can hold several: e.g. a staged solar farm with two inverter blocks. Where a project has multiple DUIDs, we sum their metrics for project-level figures and keep the per-DUID breakdown available underneath, so you can see which block was running.
How it’s calculated
AEMO’s operational telemetry carries one reading per unit roughly every 5 minutes. Each reading is instantaneous: an MW value taken at that moment, not an average over the preceding period. It is also signed, with output on one side of zero and consumption on the other.
Deriving a half-hourly figure is therefore three steps:
- Estimate each 5-minute slice. A sequence of instants has to become a representative rate for the time between them. We use the standard trapezoidal estimate, averaging the reading at the start of a slice with the reading at its end.
- Split the signed value. Generation is the positive side, Load is the magnitude of the negative side. Keeping them as two non-negative series rather than one signed one means a battery’s charging doesn’t cancel out its discharging.
- Average across the half hour. Each series is averaged over whichever of the six slices in the period actually have readings, so a dropped telemetry link produces a blank rather than a false zero.
Why average consecutive readings
A single reading is a snapshot at one instant: it doesn’t say anything about the 5 minutes on either side of it. Averaging the reading at the start of a slice with the reading at its end is the best estimate of the slice’s average value as long as output moves roughly smoothly between the two samples, which is true for the overwhelming majority of 5-minute windows.
One consequence worth knowing if you’re reconciling: a full half hour needs seven readings to build six slices, not six.
Turning MW into MWh
Each value is an average rate over a half hour:
Energy for a period (MWh) = Σ Generation(half-hourly MW) / 2Capacity factor over the same period follows from there:
Capacity factor (%) = ( Energy for a period (MWh) )
                      / ( Nameplate capacity (MW) * hours in period )
                      * 100
Our visualisations do the MW to MWh conversion for you at any grain other than half an hour. But if you’re exporting the raw half-hourly series, remember the factor of two.
Special notes
Bidirectional units and the IESS reforms. Before AEMO’s Integrating Energy Storage Systems changes took effect in late 2024, a battery was typically registered as two DUIDs (one generator and one load), and you’d see charging on one and discharging on the other. Since then, new and transitioned storage registers as a single BIDIRECTIONAL DUID that carries both. When looking at old batteries, you will see multiple DUIDs reflecting this.
Negative generation is floored to 0. A generating unit that drew a small amount of power would record a slightly negative reading. Generation floors that at zero rather than showing a negative rate. For a pure generator, the corresponding Load metric is blank, so those small withdrawals don’t appear anywhere in RenewMap.
Half hours are labelled by their start. AEMO stamps a reading with the time it was taken, and we label each half hour with the time it begins: the 09:00 period is built from readings at 09:00 through 09:30. If you’re reconciling against raw AEMO files, check which convention they use: see Data sources & coverage.
Where the data comes from
Unit telemetry comes from AEMO’s published operational data, joined to AEMO’s unit registration details (dispatch type, region, connection point, loss factor), each resolved to the version in force at the interval. Unit-to-project mapping is our own, maintained against AEMO’s registration lists (see Data sources & coverage).
Common questions
Why does my project have no operational data at all?
The most common reasons, in order: the project reports no telemetry to AEMO at all (typical for small, embedded or behind-the-meter systems), the project is outside the NEM, or the period you’re looking at predates the unit’s first telemetry. If the project is a reasonably sized (>30MW) NEM-connected asset and you don’t see generation, that’s worth reporting to us.
Why doesn’t this match the number I get from another source?
Granularity of the generation estimate may be different. We report an average rate across each 30 minutes, derived from every instantaneous reading in the period including both endpoints. It is also based on operational telemetry, which is very close to but not necessarily identical to settlement-grade metering (see Special notes).
Is generation before or after transmission losses?
Before. Generation is output at the unit, as measured by its own telemetry. Loss factors only enter when we value that output in dollars (see Revenue & Missed Revenue).
What about projects in Western Australia, Northern Territory or New Zealand?
These jurisdictions operate in separate markets with their own dispatch process and data publications. Operational Insights currently covers the NEM only (see Data sources & coverage).
Related pages
- Curtailment: the output that was available but not dispatched
- Revenue & Missed Revenue: what that output was worth
- Data sources & coverage: what’s covered, and the update cycle
- Operational metrics overview: how all the metrics fit together