What are layers?
Learn how to use layers in RenewMap to explore energy projects by status, technology, infrastructure, zones and updates across Australia and NZ.
In RenewMap, layers are data overlays that appear on top of the base map. Each layer contains a specific type of spatial data—such as project locations, technology types, infrastructure, network or policy zones. By stacking and filtering layers, you can create a customised interactive view of the renewable energy market in Australia and New Zealand.
Layers help you:
- Focus on specific project types or statuses
- Compare multiple datasets in one map view
- Add your own data to plan and analyse projects
Available layers
RenewMap supports many overlay layers out of the box, including project and status layers, renewable technology layers, infrastructure and network layers, renewable zone layers and local government layers.
Here’s an overview of the available layers in RenewMap’s interface:
- The Updates layer overlays pulsating locations on the map where projects have recently been updated.
- Project status layers allow you to add or remove projects from view based on their status, including development, construction, commissioning, operating, decommissioned and abandoned projects.
- Technology layers allow you to add or remove projects from view based on the project’s renewable energy technology. These layers include: battery, biogas, biomass, geothermal, hydro, hydrogen, nuclear, offshore and onshore wind, pumped hydro, solar, coal, distillate and natural gas technologies.
- Infrastructure layers display wind turbine and gas pipeline data.
- Network layers display current and planned transmission lines on the map.
- Renewable zones displays zoning areas from policy makers like the Australian Energy Market Operator (AEMO) and federal and state governments.
- Local Government layers outline council and municipality boundaries, helping you understand which local jurisdictions projects fall under for planning, permitting, and stakeholder engagement.
How to show or hide layers
Layers appear in the layer panel on the left side of the map.
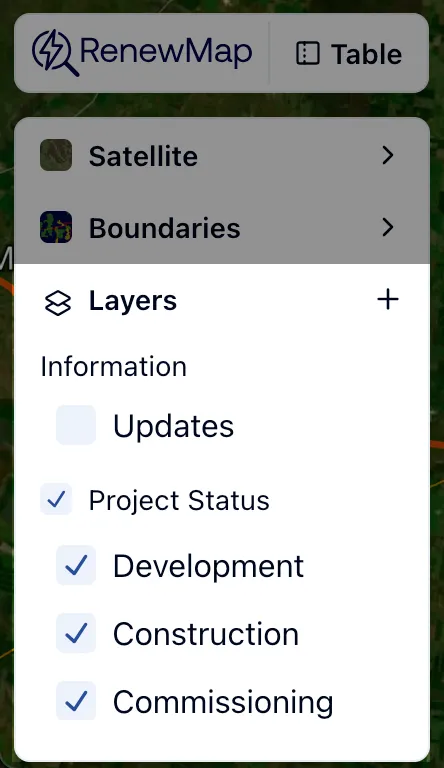
To show or hide layers:
- Browse available layers in the layer panel.
- Tick or untick the box next to your desired layer. The interactive map shows or hides the selected layer.
Tip: Start broad, then narrow. Begin with technology layers, then hide away other layers to pinpoint the projects you’re most interested in. To filter and compare projects across more data fields, use the table view. Learn more about the table view.
Upload a custom layer
You can customise your view in RenewMap by uploading your own layers to overlay on the data set. For example, project developers may want to upload land access or lease area layers to plan their projects. Supply chain partners may want to upload layers showing the boundaries of their inventory or storage locations and preferred transport routes.
Layers are stored as part of your current workspace, so you can keep a separate set in each one. Learn more about workspaces.
To upload your own layers:
- Select the + icon in the layers panel.
- Select Upload layer from computer. The Upload a custom layer dialog appears.
- Select Choose a file or drag and drop your layer file onto the dialog.
- Select Create. The layer is added to the Custom section of the layer panel.
You can upload KMZ, KML, geoJSON or JSON files up to 50MB.
Add a custom layer from a URL
You can add custom layers from various types of web map services. RenewMap supports several common formats used by mapping platforms, government agencies, and data providers.
Supported URL formats
XYZ Tile Services
These provide pre-rendered map images in tiles. The URL includes coordinates for X (longitude), Y (latitude), and Z (zoom level) and typically looks like this:
https://your.tile.server/{z}/{x}/{y}.pngCommon providers: OpenStreetMap, MapBox, custom tile servers
WMS (Web Map Service)
These generate map images on-demand from spatial databases. WMS URLs are usually include parameters such as layers and image format, for example:
https://example.com/wms?SERVICE=WMS&REQUEST=GetMap&LAYERS=layer_nameCommon providers: Government agencies, scientific institutions, GIS platforms
WFS (Web Feature Service)
These provide raw spatial data that RenewMap can style and display. WFS URLs include parameters to specify the data format:
https://example.com/wfs?SERVICE=WFS&REQUEST=GetFeature&OUTPUTFORMAT=application/jsonCommon providers: Open data portals, municipal governments, research organisations
ESRI Services
These are provided by ArcGIS Online and ArcGIS Server installations. There are two main types:
Feature Services (for interactive data):
https://services.arcgis.com/org/arcgis/rest/services/ServiceName/FeatureServer/Map Services (for pre-styled maps):
https://services.arcgis.com/org/arcgis/rest/services/ServiceName/MapServer/Common providers: ESRI, government agencies using ArcGIS, utility companies
How to add a layer from URL
To add a custom layer via URL:
- Select the + icon in the layers panel
- Select Add layer from URL. The Add a remote layer dialog appears
- Paste the URL to your map service
- Select Test connection. RenewMap will automatically detect the format and verify it works
- If successful, you’ll see a Connection successful message
- Select Add. The layer is added to the Custom section of the layer panel
Tips for finding map service URLs
- Government data: Many agencies publish their spatial data through web services. Look for “Web Services”, “API”, or “Developer” sections on their websites
- ArcGIS Hub: Search hub.arcgis.com for thousands of public datasets with ready-to-use service URLs
- OpenStreetMap: Various providers offer tile services based on OSM data with different styling
- Academic institutions: Universities and research organizations often publish environmental and infrastructure data through web services
- Trusted sources: Use of third party sources can incur costs. Be sure to check with your layer provider for any costs or security concerns
Common issues and solutions
“Service requires authentication” or “ESRI service requires authentication”
- The data provider requires a login or API key to access their service. Look for public alternatives or contact the provider about access.
“renewmap.com.au is not allowed to access this service”
- The service doesn’t allow web browsers to connect directly. This is common with many WFS services. Try finding an ESRI FeatureServer version of the same data instead.
“Unable to connect. Check your connection to the internet”
- There might be a temporary network issue. Check your internet connection and try again in a few moments.
“Service took too long to respond”
- The service is running slowly or may be overloaded. Try again later, or look for an alternative data source.
“WFS service validation failed”
- Many WFS services block browser access for security reasons. ESRI FeatureServers are usually a better choice for web maps like RenewMap.
“The URL may not return valid tile images”
- For XYZ tile services, make sure your URL includes
{x},{y}, and{z}placeholders and points to actual image files.
Layer connects but shows no data
- The service might cover a different geographic area than Australia/New Zealand
- Try zooming to different areas or zoom levels to find where the data is located
- Some services only show data at specific zoom levels
Need help finding specific data? Contact our support team at [email protected] who can assist with locating appropriate map services for your use case.