
Headroom
How RenewMap calculates transmission Headroom: the room left on a line after the rating, the flow and the network constraints the NEM dispatch engine actually enforces, and how to read the result.
Headroom is a measure of how much more flow a piece of transmission equipment could carry at any point in time, as far as the market operator is concerned.
There are two ways to ask the question. The physical one: how much more could this line carry? That is the gap between its rating and its flow (see Line Flow & Ratings). The operational one: how much more would the market operator actually let anyone push through the line? Headroom answers the operational one, starting from the physical gap and reducing it for the limits the market enforces.
The two answers can be very different. A line can sit at half its rating all afternoon and still be completely ‘full’ from the operator’s perspective, because the NEM dispatch engine is limiting upstream generation to protect the system against something that hasn’t happened yet.
Note: At this stage, RenewMap only includes thermal constraints and not stability or other constraint types. It also doesn’t yet include a small portion of thermal constraints with particularly complex constraint formulations.
Why the market limits flow below the rating
The NEM is operated to withstand the loss of any single credible element without cascading. So dispatch has to be safe not just for the network as it stands, but for the network as it would be a moment after a line trips, a transformer fails, or a generator disconnects. If losing line A would overload line B, then flow on B must be held below its own rating while A is still intact.
AEMO implements this, and other operational constraints to the network, with constraint equations: thousands of rules, each one a limit on what dispatch is allowed to do, fed into the dispatch engine every 5 minutes. On one side of each rule sits a weighted combination of the things dispatch can control (generator outputs, interconnector flows), and on the other sits the limit itself, which is usually not a fixed number but a value recomputed each interval from live network conditions.
A few properties of that system explain most of what you’ll see in this metric:
- Constraints are often about somewhere else. A constraint that limits flow on line B is typically formulated around the loss of line A.
- Constraints are shared. One equation can cover a dozen generators and several parallel circuits at once. When it binds, none of them can increase output, however much room any individual element appears to have.
- Constraints bind before ratings do. That’s the design intent. The gap between rating and flow on an intact network is exactly the room the constraint is deliberately preserving.
A constraint is binding when dispatch has been pushed right up against that limit and can’t increase anything on the controlled side without breaching it. AEMO publishes the solved state of every constraint in every interval, including how much room was left against its limit, and that published solution is what this metric is built from.
How Headroom is built
Headroom is the lower of the physical gap between rating and flow, and the room the enforced constraints leave:
Headroom = MIN( constraint room, rating - flow )Reading the two figures side by side:
- Equal to rating less flow: no matched thermal constraint was limiting the equipment. Its own rating was the operative limit.
- Lower than rating less flow: a constraint was invoked, and the room it left was less than the physical gap would imply.
- Zero: as far as the enforced thermal constraints go, there was no usable room at all, however much rating was nominally spare.
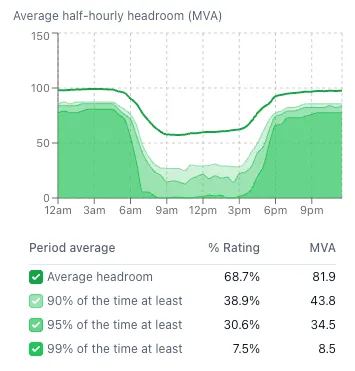
In the Headroom chart in a transmission line’s Operational tab, binding periods show up as a dip away from the physical limit.
Reading the percentile bands
An average can be misleading. A line with plenty of average Headroom can still be regularly completely full. So alongside the average, the Headroom chart shows how low Headroom got, using percentiles of the half-hourly Headroom values.
- The bold green line is the average Headroom.
- The green bands beneath it show the low end of the distribution. The darkest band runs from zero up to the 1st percentile, the next from the 1st to the 5th, and the lightest from the 5th to the 10th. Darker means you can be more confident that headroom is available, e.g. available 99% of the time.
Only the low end is shown because the useful question is how tight the line gets, not how much room it has on its best days.
If you see ‘90% of the time 0 MVA is available’, that means that there was no headroom available at least 10% of the time.
How they’re calculated
- Percentiles are taken over the half-hourly Headroom values in the selected period, and over the time-of-day hours selected. In the time-of-day view, each half-hour slot is the percentile across all the days in the period. When the chart is grouped by day, week, month or longer, each point is the percentile across the half hours in that group.
- When the chart is grouped by half hour there is only one value per point, so only the average is drawn.
- To ensure performance, percentiles are approximate, and are less accurate at the extremes.
- Each half-hourly value is already a 30-minute average, so a brief dip inside a half hour is smoothed out and doesn’t reach the percentile bands.
- At the line level, each percentile is the smallest of the percentiles at the line’s measurement points, the same conservative rule used for the line’s Headroom itself.
Where you see it in RenewMap

| Where | The Headroom chart in a transmission line’s Operational tab, the Headroom and Headroom % map visualisations, the network table, and data exports. Percentiles are shown in the Headroom chart |
| Granularity | 30 minutes, per measurement point, combined to the transmission line |
| Units | MVA or MW, matching the flow and rating basis for that equipment |
| Series names | headroom_constrained, headroom_constrained_pct at the measurement point; line_headroom_constrained, line_headroom_constrained_pct at the line |
| Applies to | Equipment with both a rating and flow telemetry. Constraints reduce it where at least one thermal constraint is matched |
| Blank when | There is no rating or no flow. Where no constraint is matched, Headroom is the rating less flow |
On the map, the Headroom and Headroom % operational visualisations colour each line from red (little headroom) through yellow to green (plenty). The Headroom scale runs from about 20 MVA (red) through about 500 MVA (yellow) to 1,000 MVA and above (green); the Headroom % scale runs from 40% (red) through 70% (yellow) to 100% (green). Lines with no Headroom value are grey. In the network table, the Headroom and Headroom % columns can be sorted and filtered like any other.
How it’s calculated
All of this happens per 5-minute dispatch interval, per measurement point, then rolls up to 30-minute windows.
There are four steps, and the important thing about them is where the numbers come from at each one:
1. Work out the physical gap. This is the rating less the equipment’s flow:
rating - flowIt is calculated at each measurement point, pairing that point’s rating with the absolute flow (defined in Line Flow & Ratings). Two fallbacks apply. Where a measurement point doesn’t report a normal rating, its emergency rating is used in its place, and failing that its load shedding threshold. And where MVA flow isn’t reported, MW flow is used instead. Both fallbacks change what the number means: a figure built from an emergency rating describes short-term capacity, not continuous capacity, and one built from a load shedding threshold is more generous again. A figure calculated with MW rather than MVA will overstate room because it excludes reactive power.
2. Identify the thermal constraints. We use AEMO’s classification of what is and isn’t a thermal constraint.
3. Work out which constraints are actually limiting this piece of equipment. This is non trivial: AEMO publishes constraint solutions and it publishes equipment telemetry, but it does not publish a mapping from one to the other. A thermal constraint routinely references equipment that contributes to the limit without being the thing being protected by it, so we don’t include every constraint that mentions a line’s flow. We only include the constraints on the line if that is the one being protected.
4. Convert the constraint’s headroom into this equipment’s units. We take the constraint headroom and rescale it into the equipment’s units and compare it against the physical gap, taking whichever is tighter.
Where several thermal constraints match the same equipment in the same interval, the most restrictive wins rather than their effects being added together, because capacity is set by whichever limit is tightest, not by their sum. Where a constraint would nominally allow more than the equipment’s own rating does, the physical gap applies: the metric never reports more room than the metal has.
Values are then averaged across the intervals in the half hour, with intervals that had no matched constraint contributing their physical gap, so a constraint that bound for part of a period produces a partial reduction rather than an all-or-nothing step. At the line level, the smallest Headroom across the line’s measurement points applies, so the result is deliberately the conservative reading rather than an average.
The percentage figure divides this by the equipment’s own rating, the same one the physical gap is measured from, per interval before averaging.
Constraints that need more than a flat sum
Not every thermal constraint is a simple list of terms. A significant minority are written with internal structure, most commonly some version of “take the tighter of two limits”. Those need to be evaluated as the dispatch engine would have evaluated them before the constraint can be attributed to any particular piece of equipment, and we do that where we can.
In all such cases the headroom figure itself still comes from AEMO’s real solved values; only the attribution to a specific piece of equipment depends on our evaluation of the structure. Some formulations are too complex to attribute confidently, and RenewMap currently leaves those out of headroom calculations altogether rather than guessing.
Special notes
This is derived, not published. AEMO publishes constraint solutions and equipment telemetry; it does not publish “headroom per line”. The matching between constraint equations and equipment, and the conversion of a constraint’s remaining room into equivalent capacity, are our own work. If a decision turns on a specific figure, treat it as a strong indicator and verify against a network study.
Unmatched constraints don’t reduce anything. Where a constraint is limiting equipment but we haven’t matched it, it won’t appear anywhere. The metric can therefore overstate available room. The same applies to skipped complex formulations.
Headroom is not connectable capacity. Connection capacity is determined by detailed modelling that considers things like system strength, voltage, other upcoming connections, and downstream or upstream congestion. A line may have plenty of room, but there is a congested line that the flow must pass through one or two hops along the network. Headroom is a screening signal for where the network is tight and where it isn’t.
Thermal only. Voltage stability, transient stability, oscillatory stability and system strength limits are excluded by design. In long, weak, high-renewable corridors those are often the binding limits, and none of them appear here. A line showing generous Headroom may still be effectively closed for stability reasons.
Where the data comes from
Constraint solutions, constraint classifications and the constraint definitions in force at each interval all come from AEMO’s published data, as does the equipment flow and rating telemetry described in Line Flow & Ratings. Nothing is re-solved or re-simulated. What RenewMap adds is the matching between constraints and equipment, and the conversion of a constraint’s remaining room into an equivalent capacity figure for a specific line.
Common questions
Why is Headroom lower than rating less flow?
Because the market is enforcing a limit tighter than the equipment’s own rating, often a contingency constraint, which by design holds intact-system flow below the intact-system rating.
Why is Headroom exactly rating less flow on some lines?
Either no thermal constraint was binding on that equipment during the period, or no constraint could be matched to it.
Why don’t the Headroom percentiles match the % of Time a line is binding?
A line might be binding 2% of the time, yet its 99% Headroom figure is above zero. If the line were constrained 2% of the time, you’d expect the 99th percentile to be zero.
The underlying data is the same. The difference is the time grain. % of Time binding is calculated on each 5-minute dispatch interval, so it is the more precise measure. Headroom is averaged to 30 minutes before the percentiles are taken.
Take a half hour where five of the six 5-minute intervals had zero Headroom and one had 6 MVA. Its half-hourly Headroom is (0 + 0 + 0 + 0 + 0 + 6) / 6 = 1 MVA. That is the correct average, but the half hour no longer counts as zero, even though the line was binding for most of it. Spread over a period, these partly binding half hours push the percentiles up, so they don’t measure the 99th percentile of 5-minute Headroom.
Use % of Time and Binding Hours to answer how often the line was constrained, and the percentiles to see how much room there typically was.
Does this include voltage or stability constraints?
No, thermal constraints only.
Can I use this to size a new connection?
Operational Insights is a strong screening tool for identifying which corridors are congested, how often, and at what cost, but it should not be relied on in isolation. Sizing a connection requires a power flow and stability study of the network with your project in it, which changes the flow pattern the metric is measuring.
Which constraint caused the reduction?
The metric reports the effect rather than the responsible equation. Binding Hours & Marginal Value gives the cost and frequency of binding on the same equipment for the same intervals, which in practice narrows it down quickly. If constraint-level detail would be helpful, please get in touch so we can understand how we could better present what you need.
Related pages
- Line Flow & Ratings: the rating and measured loading behind the physical gap
- Binding Hours & Marginal Value: how often limits bind, and what they cost
- Curtailment: what binding constraints do to nearby projects