What is the table?
Explore and compare renewable energy projects and organisations in RenewMap’s table view. Filter, group, customise columns and export project data to CSV.
RenewMap tracks more than just the location of renewable energy projects in Australia and New Zealand. It also has table views of projects and organisations in the industry.
Some key features include:
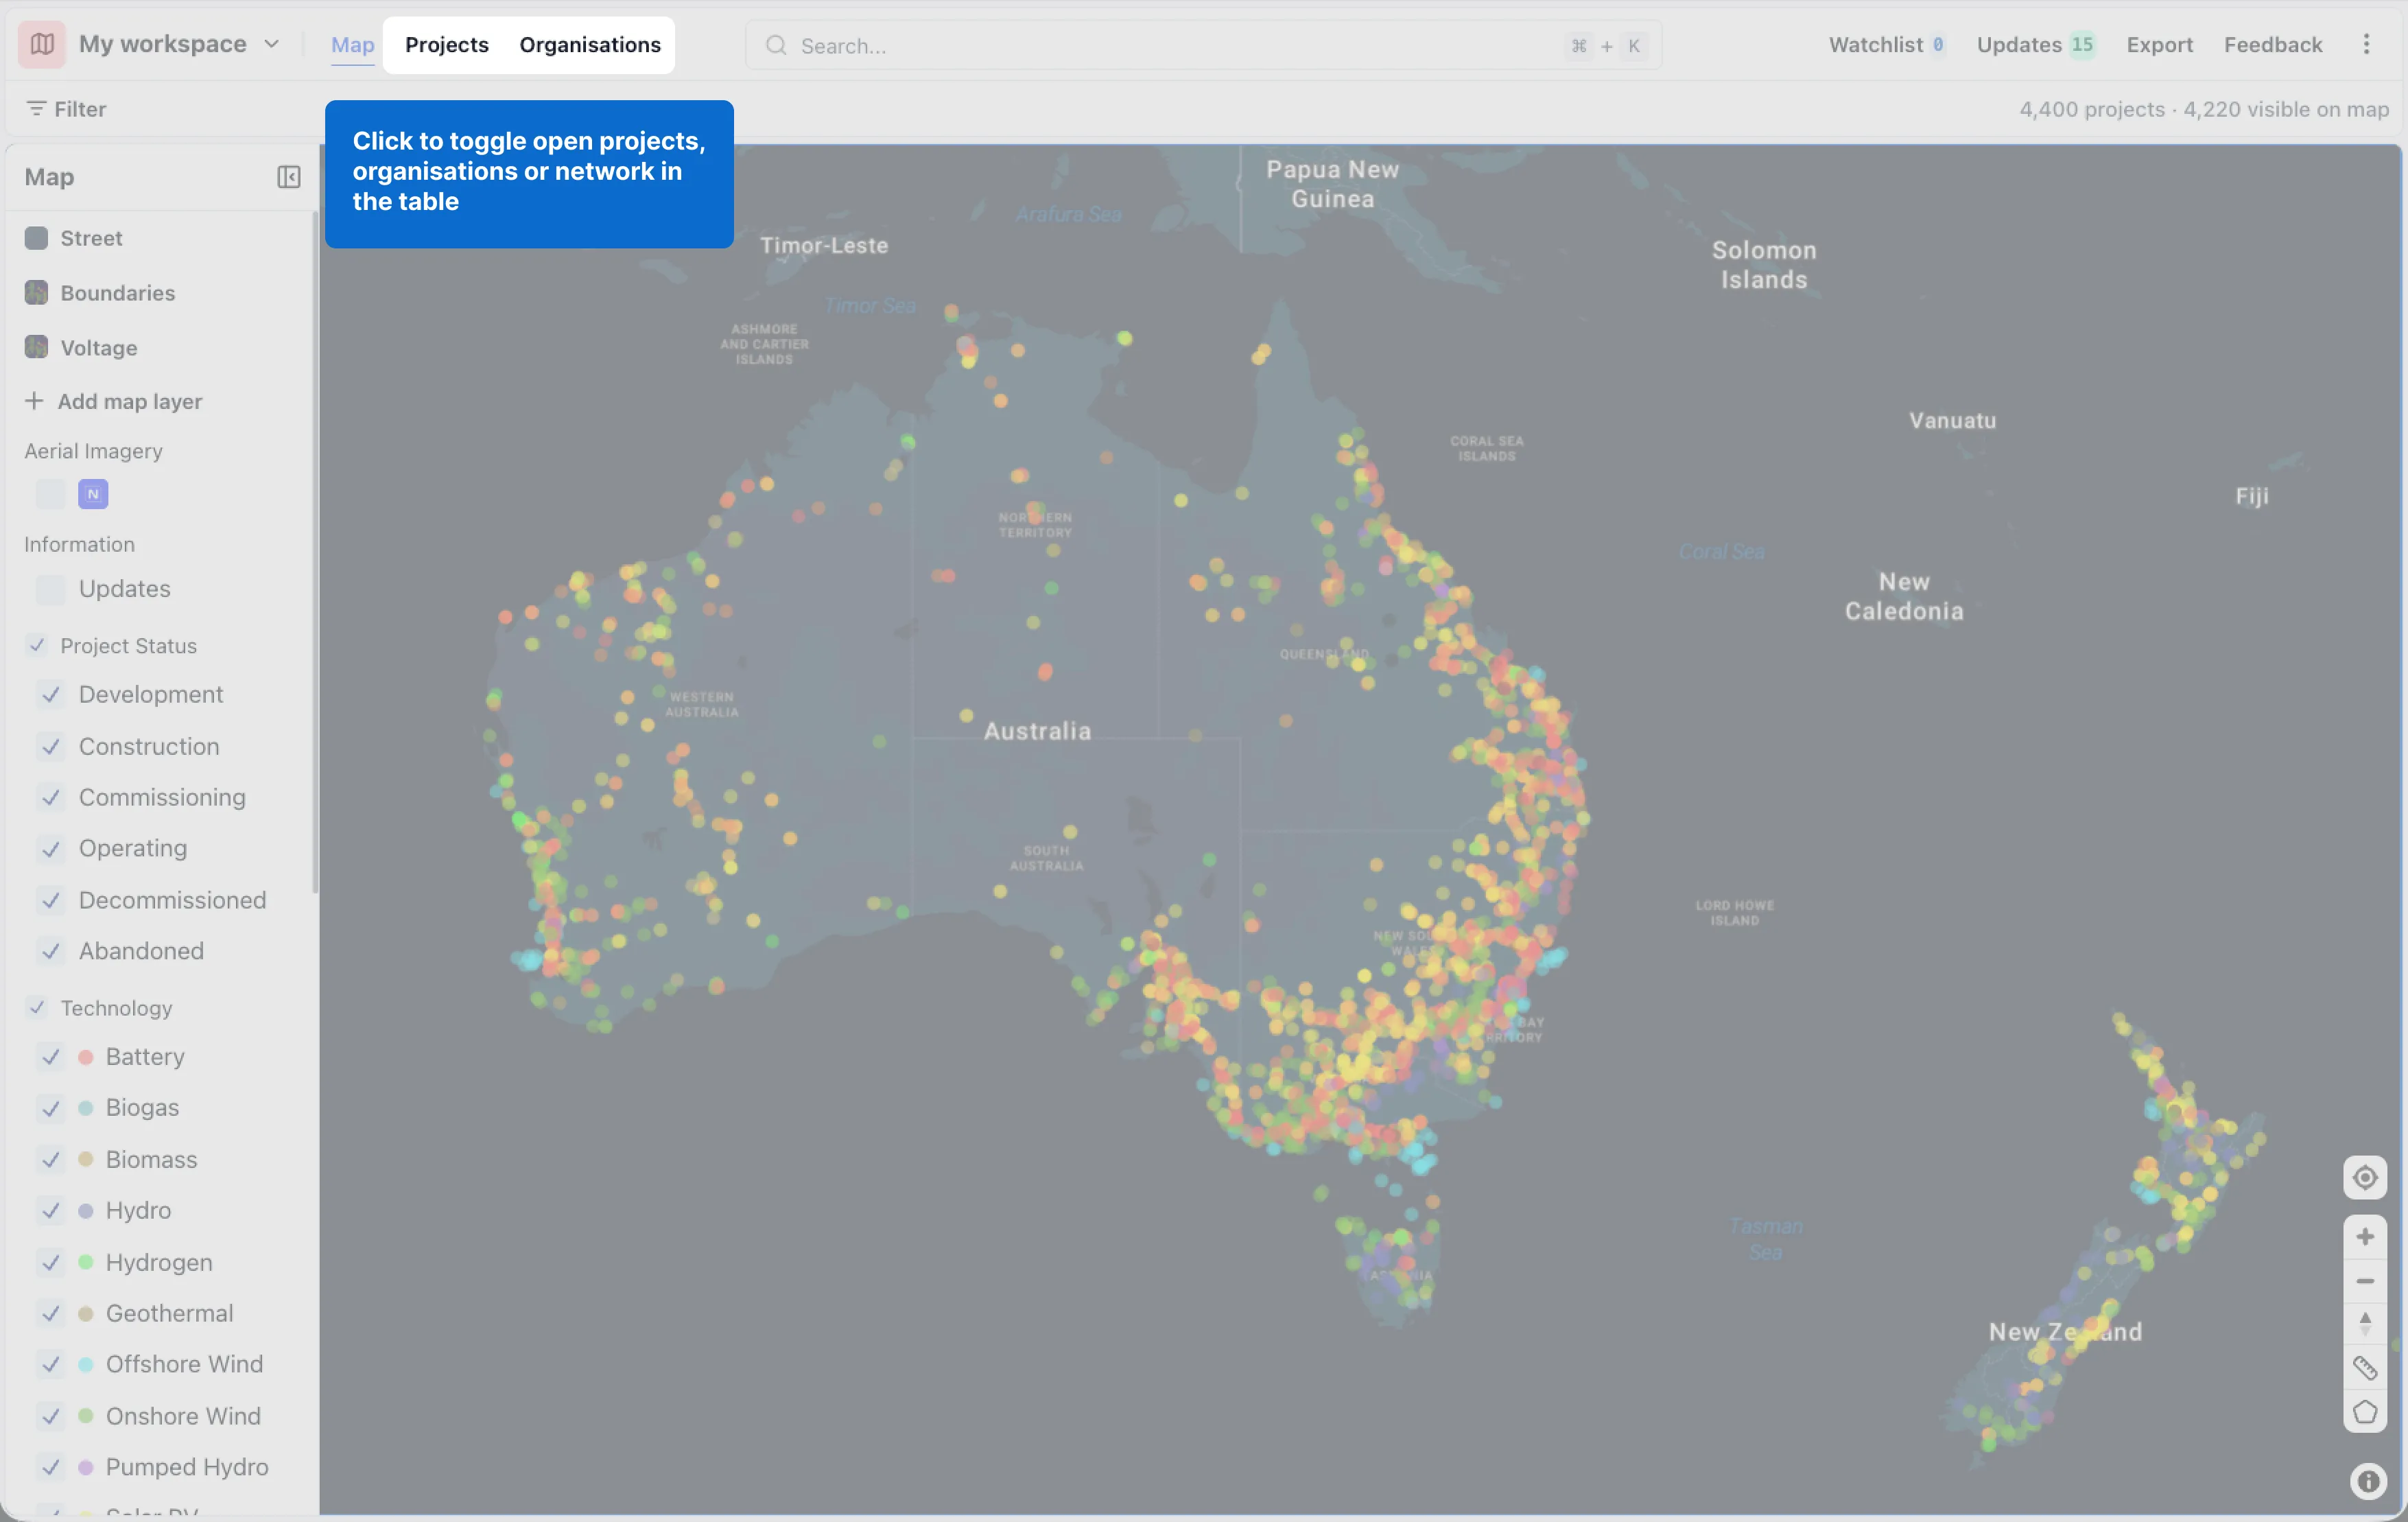
- The top most navigation buttons “Projects” or “Organisations” opens a table view.
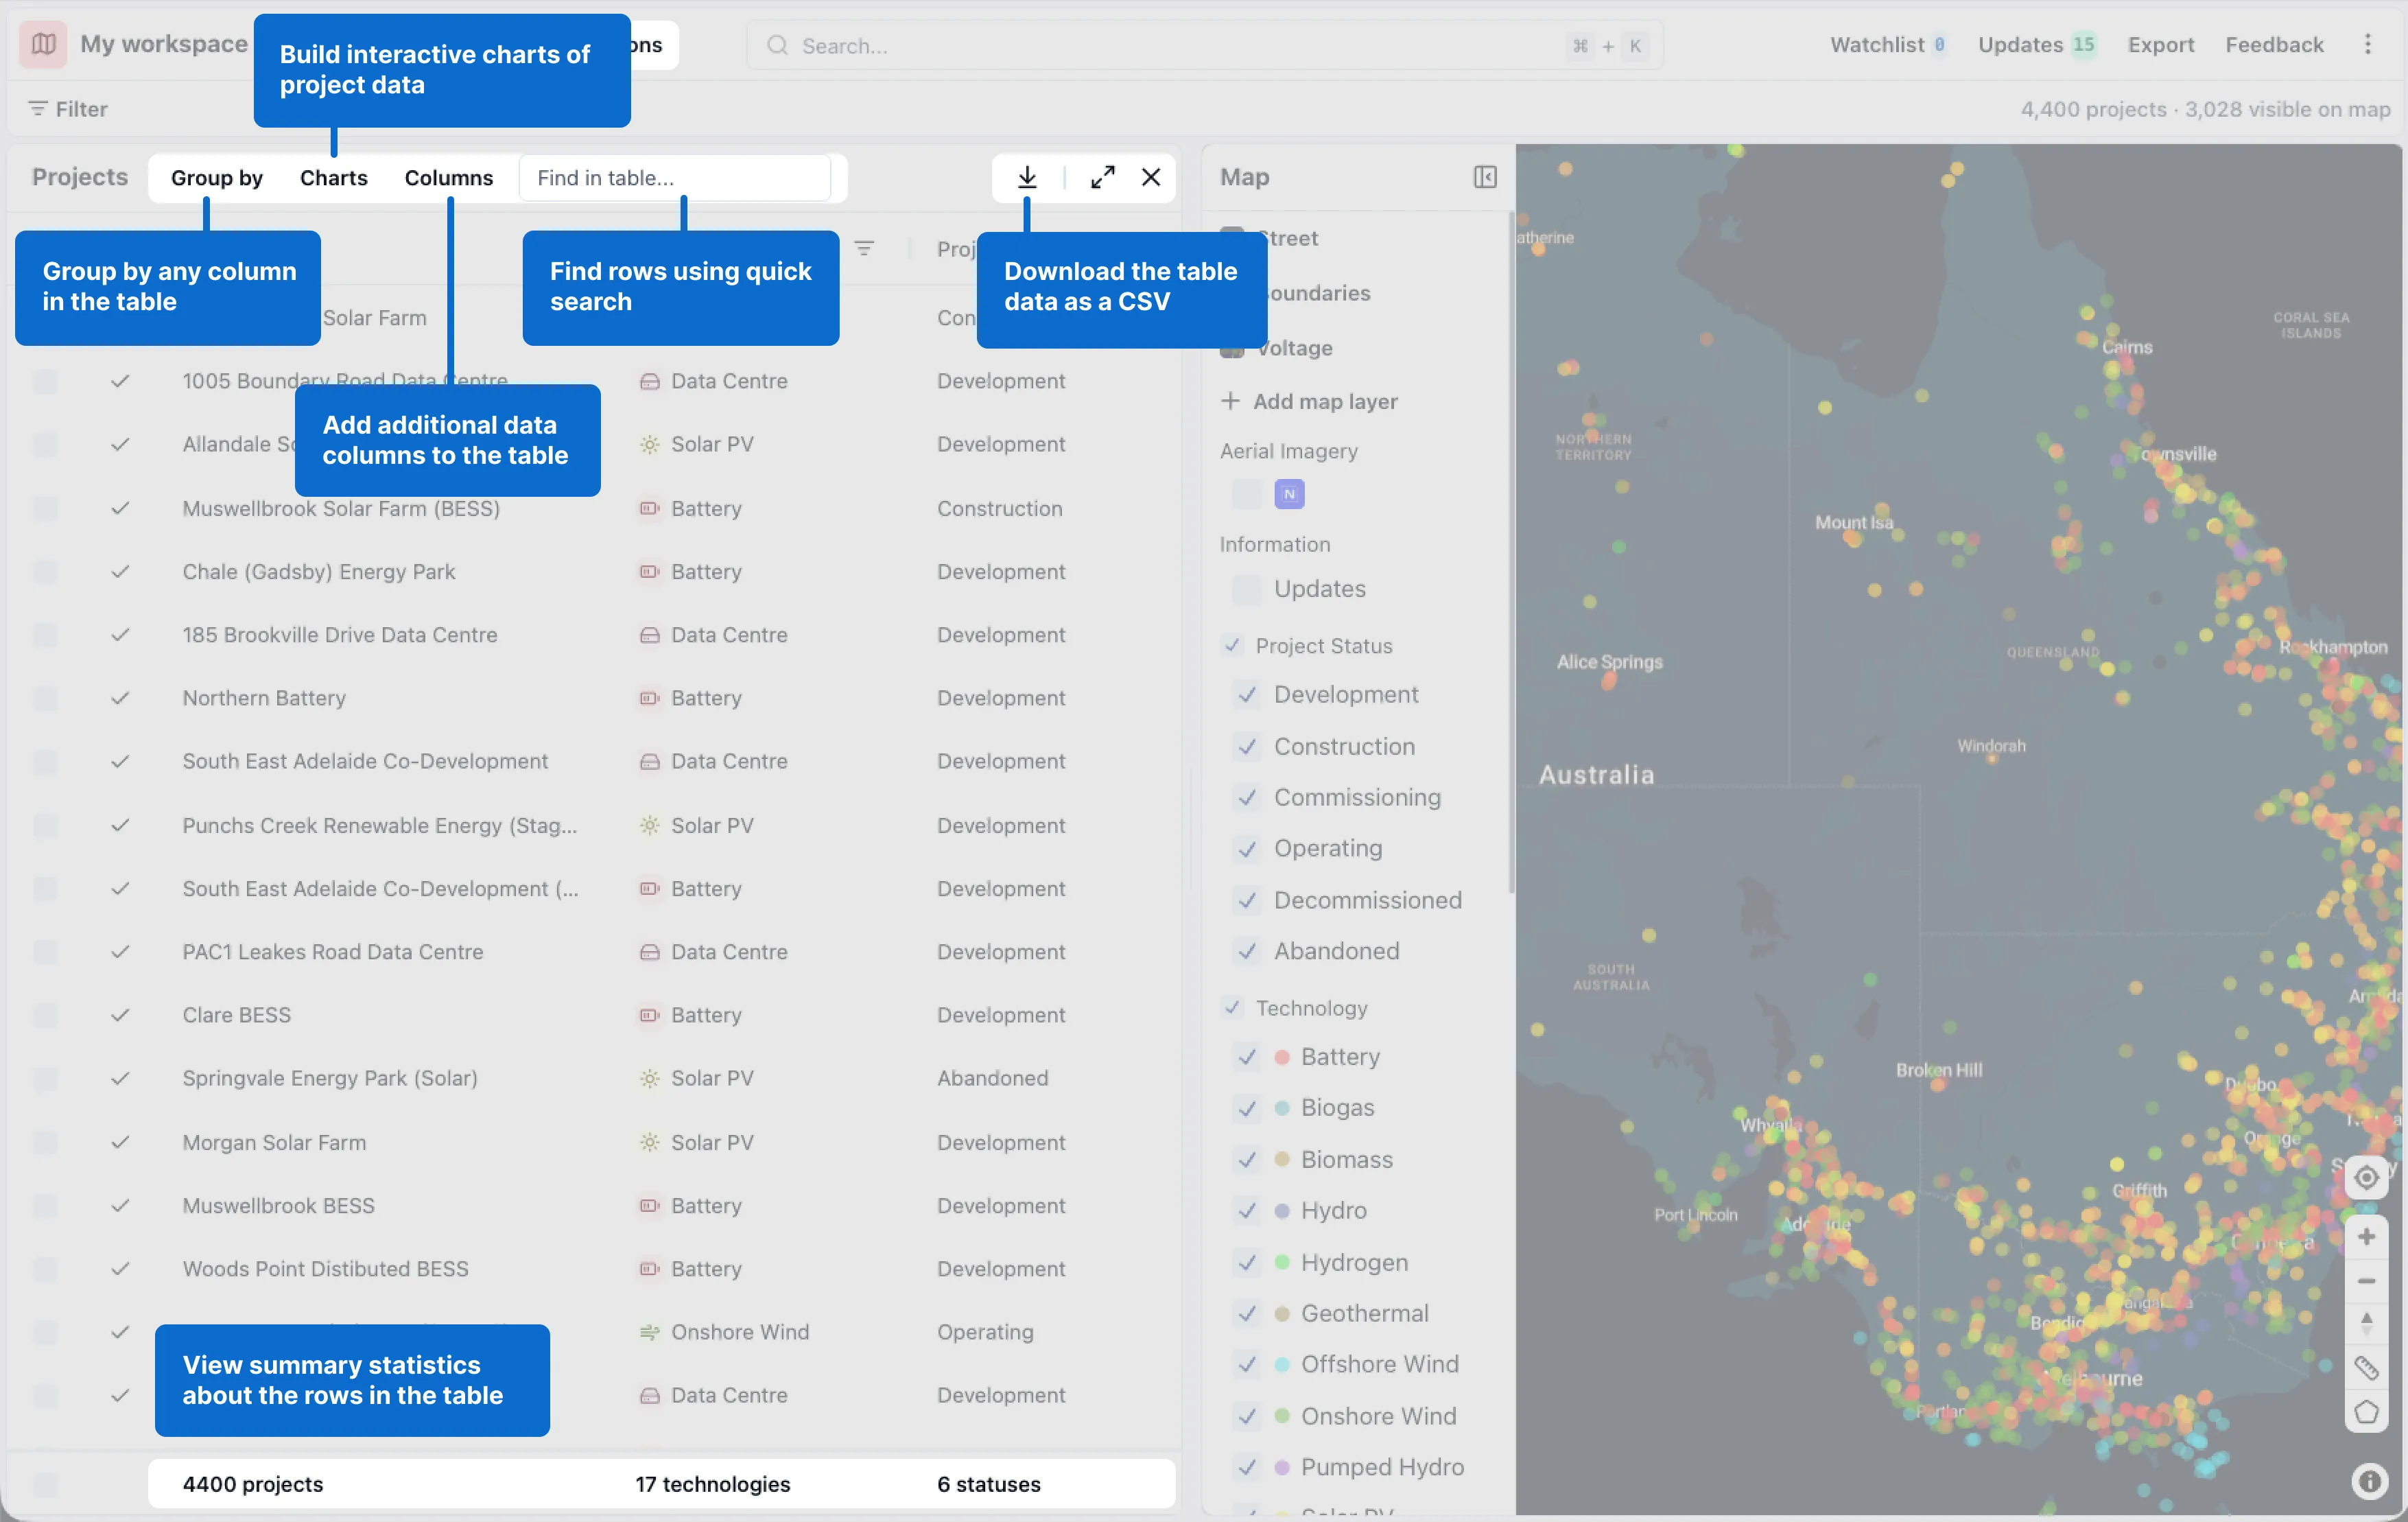
- You can expand the table to full screen if you need more space to compare row details.
- Group projects in the table by project details like location, technology, project status and more. Group organisations in the table by organisation details like role or total project capacity.
- Use filters to show rows from the table (and the map) so you can focus on the projects or organisations that matter most to you.
- Add or remove columns to compare projects based on the details you care about.
- Select a row from the table to see all details about that project or organisation.
- Get summary information about the rows you’ve filtered down to.
- Export the data in the table to CSV for use in other systems.
How to see projects or organisations as a table
Select Projects or Organisations from the RenewMap header, to open a table view.
How to add or remove columns from a table
RenewMap stores details into fields available in table and right-hand detail views. To compare details between projects or organisations - or group rows by specific fields - you can add these fields as columns in their respective tables.
To add or remove columns from the table:
- Select the “columns” button. The columns dialog appears.
- Search for or scroll to locate the field you want to add as a column in the table.
- Tick or untick the box next to the column you want to display or hide. The column is added to the table.
Tip: Less common fields may not appear in the column dialog by default. To expand the fields shown in any specific field category, you may need to select Show all or search for a specific field name.
Projects table
For projects, you can use the table to easily find project information, including status, capacity, storage size, developers, owners and more. The table lets you filter, compare and analyse projects quickly, giving you actionable insights for project planning, market analysis, or investment decisions.
RenewMap tracks an extensive amount of details on renewable projects in Australia and New Zealand. We categorise these into the following groups:
- Overview information, like project and development application (DA) status, owner, project size and technology.
- Location information, include the related state, council, renewable energy zone and federal electorate.
- Infrastructure information, like turbine count, battery configuration, array mount types and more.
- Development Approval information like DA submission, approval and modification dates.
- Environment Protection and Biodiversity Conservation (EPBC) act information, like code, status, outcome and referral details.
- Timeline information, or major milestones surrounding the DA.
- Network information, like the Australian Energy Market Operator’s (AEMO) key connection information (KCI) identifier, voltage and classification and other AEMO timeline data.
- Commercial information, like a list of associated contractors.
- Regulatory information, like REZ access rights, Clean Energy Regulator accreditation, DCCEEW’s National Renewable Energy Priority List and more.
- Financial information, like Power Purchase Agreements, the Capacity Investment Scheme (CIS), Australian Renewable Energy Agency (ARENA) funding, Clean Energy Finance Corporation (CEFC) funding and more.
Organisations table
In the table view you can easily search, filter and export organisations based on such as their role in the industry or the number of completed projects, or total project capacity that they operate.
How to filter the table to find a row
To filter the table:
- Select the filter icon in the column’s header to see the available options for that field.
- Choose a filter option to narrow down the table. For example, in the Technology column, select Battery to view projects labeled as battery technology projects.
How to group rows in the table
You can also group rows based on specific fields. For example, you can group projects based on their DA status, location, or group organisations by their role in the industry.
To group rows in the table:
- Select Group by. The Group by dialog appears.
- Select the field you want to use to group rows. The table rearranges based on your selection.
Select the > expand icon in a row to see the rows grouped under the label. The first row in each expanded group shows summary information about the rows in that group.