
Binding Hours & Marginal Value
How often a transmission line's thermal constraints bind, and how RenewMap values one extra MVA of rating on the line, including why that differs from AEMO's constraint Marginal Values.
Every 5 minutes, the NEM dispatch engine solves an optimisation problem: meet demand as cheaply as possible, using the offers submitted, without breaching any network limit. Problems of this shape produce a useful by-product: for every constraint, the solver can report how much cheaper the answer would have been if that constraint had been slightly looser.
RenewMap uses that by-product, and the solver’s record of which constraints were binding, to answer two questions about a specific line.
How often is this line constrained? A constraint binds when dispatch has been pushed right up against its limit. Binding status flips on a 5-minute cadence, so we report it as a proportion of each half hour, and summing those proportions over a period gives Binding Hours.
What could one extra MVA of rating on this line have been worth? That is the line’s Marginal Value, in dollars per MW of extra rating. A Marginal Value of $40,000 over a year means that if the line’s rating had been 1 MVA higher all year, the cost of dispatch could have been about $40,000 lower. That cost is measured using the prices generators offer, so the figure assumes those offers are close to the price each generator would really accept. Often they aren’t (see How to read a Marginal Value).
Together they answer the questions that matter for congestion analysis: is this line constraining the market, how much of the time, and how valuable is relief when it is?
How to read a Marginal Value
It’s the value of the next MVA, not the average cost of congestion. Marginal Value is the worth of the first extra MVA of rating. It is not the total cost the constraint imposed, and it can’t be divided out to get an average cost per MVA. Each extra MVA is worth less than the one before: cheaper generation gets dispatched first, and once enough room is added, the constraint stops binding and the next limit takes over. A 100 MVA uprate is therefore worth less, often much less, than 100 times the Marginal Value.
It measures the change in dispatch cost, nothing else. It is the drop in the total as-offered cost of meeting demand. It is not congestion rent, a generator’s lost revenue, or the effect on consumer prices.
It’s based on offers, and offers can distort it. Dispatch cost is measured using the prices generators offer at, not what it really costs them to run. The same physical limit produces a small value when cheap alternative generation is available, and a very large one when the alternative is a peaker offering near the market price cap. A handful of high-price intervals can make up most of a year’s total.
The biggest distortion comes from wind and solar. They commonly offer at the −$1,000 market floor to make sure they’re dispatched, not because they would really run at −$1,000. When a constraint curtails them, letting them run looks like a saving of more than $1,000 for every MWh they produce. In reality they wouldn’t be dispatched at −$1,000, so the real saving is much smaller. As such, the marginal value can be significantly inflated due to bidding behaviour of projects on the constraints, far above the real value of extra rating.
Why it differs from AEMO’s figures
AEMO publishes a Marginal Value for each constraint equation, not for each line, and in the units of that constraint. Each constraint is normalised to the generator that contributes most to the flow on the line. So AEMO’s Marginal Value is the value of adding enough line capacity to let that one generator produce 1 more MW, which is not a very intuitive unit. It also means two constraints on the same line are usually in different units, so their values can’t be compared or added as published. This doesn’t matter for AEMO, which uses these values to set prices and rank constraints, but it means the raw figures aren’t really in a useful unit.
RenewMap converts each constraint’s Marginal Value into the value of one extra MVA of this line’s rating, using the constraint equation itself, then adds up every constraint that uses the line’s rating. Adding them is correct because raising the line’s rating loosens all of them at once.
The Marginal Value we calculate at a constraint level matches AEMO’s number, but the line Marginal Value we report is in different units and potentially combines multiple constraint equations.
Where you see it in RenewMap
Both are shown in the Operational tab of a transmission line.
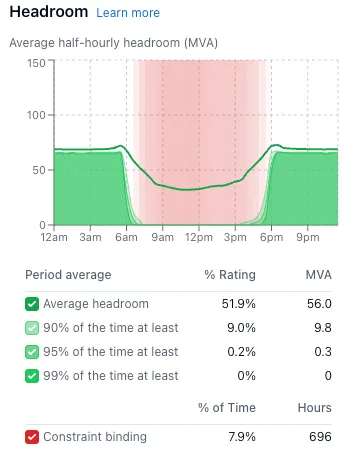
Headroom chart. Periods when a thermal constraint is binding are shaded red behind the headroom lines. The shading is darker the larger the share of that interval spent binding, on a logarithmic scale from 0 to 100%, so small amounts of binding are still visible. A row under the chart shows % of Time and Hours for the selected period, or for the interval you are hovering over.
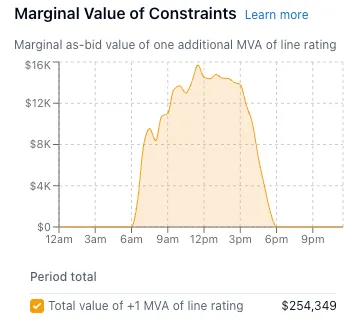
Marginal value chart. Shows the as-bid value of one additional MVA of line rating over time. The table beneath it shows the total for the selected period, or for the interval you are hovering over.
| Granularity | 30 minutes, per transmission line |
| Units | Binding is shown as % of Time and as Hours. Marginal Value in $ per MVA of additional line rating |
| Series names | line_binding_pct, line_binding_hours, line_marginal_value |
| Applies to | Equipment with a flow reading and a rating, and at least one matched thermal constraint. See Headroom |
| Blank when | No flow reading or no rating. Where flow and rating exist but no constraint is matched or binding, the values are zero rather than blank |
How it’s calculated
- Match constraints to the line. Thermal constraints are tied to the line using the same conservative matching described in Headroom. Where a constraint takes the tighter of two lines, its value is credited only to the line that was tighter in that interval, or split evenly if they were tied.
- Convert to the line’s basis. For each 5-minute interval, each matched constraint’s Marginal Value is converted to a value per MVA of this line’s rating, as described above. Values are capped at the market price cap.
- Add across constraints. The converted values are summed across all matched constraints. This is the opposite of Headroom, which takes the single tightest constraint, because capacity is set by the tightest limit while value accumulates across every limit that extra rating would relieve.
- Combine to the half hour. The six 5-minute values are combined into a half-hourly value. The line counts as binding in any interval where a matched constraint is binding.
Within each half hour, the share of intervals that were binding is the fraction of that half hour spent binding: none of it, all of it, or a third for two of the six intervals. Intervals with no matched constraint count as zero rather than being dropped, so summing over a period gives a real duration:
Binding Hours = Σ share of half hour binding / 2   over the half hours in the period
% of Time     = Binding Hours / hours in the period × 100
A month with 200 Binding Hours out of 730 means a thermal constraint was holding this line about 27% of the time. Marginal Value over a period is the sum of its half-hourly values.
Where the data comes from
Whether a constraint is binding comes from AEMO’s published dispatch results. Constraint Marginal Values come from AEMO’s re-run of dispatch, which relaxes constraints that were violated or priced at the violation penalty before pricing the rest. The two can differ, so an interval can be binding with a zero Marginal Value, or the reverse. Constraint definitions and telemetry used to tie them to specific lines also come from AEMO’s published data.
Common questions
Why is Marginal Value zero when the line looks full?
Three possibilities: the line is heavily loaded but nothing was actually binding. The binding limit was a stability or voltage constraint, which this metric excludes. Or the binding constraint couldn’t be matched to this line.
Is Marginal Value the cost of congestion?
No. It’s the value of one more MVA of rating in that interval. The total cost of congestion, or the benefit of a large uprate, needs dispatch to be re-solved with the line changed, which is a modelling exercise well beyond what published data supports.
Why is it different to AEMOs ‘Binding Impact’ metric?
These are ultimately the same measure, however AEMO’s figures are per constraint and in each constraint’s own units. RenewMap’s are per line, converted to a value per MVA of the line’s rating and added across every constraint the line affects. See Why it differs from AEMO’s figures.
Can I get a list of which constraints were binding?
Not at this stage; the metric reports the combined effect on the line. However we’re working on making this breakdown available
Related pages
- Headroom: the capacity effect of the same constraints
- Line Flow & Ratings: the physical limits being protected
- Curtailment: what binding constraints do to nearby projects
- Data sources & coverage: which equipment is covered, and why