On building RenewMap: Product development rhythm

The rhythm of product development at RenewMap is a beat of code, data and feedback. You move between modes as a RenewMap product engineer. Designing, building, talking to customers, repeating.
Most of the time it's a steady beat. Features hum along and improvements ship in a regular swing. Other times, it's more off-beat. Wrong assumptions, missed designs, critical feedback, rework. RenewMap jazz.
This is a blog about one jazzy feature we shipped in 2025.
Approvals matter
Every Australian energy project needs a Development Application (DA) approval. Some projects need an additional environmental approval under the EPBC Act. Both approvals are major milestones to progress a project from development to construction. Both approvals impact project timelines.
This year we did a deep dive on DA and EPBC approval time periods. Alice wrote an excellent blog about how project technology and location changes assessment time periods.
The blog was a smash. Lots of interest, re-posted in different places, and new customers found RenewMap through its reach. Strong signals that people cared.
We wanted to make this data available in RenewMap.
Approval estimates
"When will this project get approved?"
We wanted to build features that helped customers answer this question. The product challenge was how to fold data on approval timelines into RenewMap.
The survival analysis provided percentiles of project approval time periods. For example, 75% of BESS projects in NSW got DA approval within 25 months of submission.
The idea of an approval estimate formed. Take the 75th percentile as an upper bound estimate for when a project was likely to be approved. Show the estimate in the project details panel next to approval fields and milestones in the timeline.
The approval estimate answered "when will this project get approved?" in the most direct way.
Iteration 0
At RenewMap, features usually start their life as mockups. Mockups are rudimentary sketches of user interfaces, presented as features or solutions.
The crappy appearance of a mockup is its strength. They look low effort, so people don't feel they're being harsh with feedback. There's minimal detail, which leads to discussion focused on the ideas. They're also full of gaps. Learning how people fill these gaps is insightful.
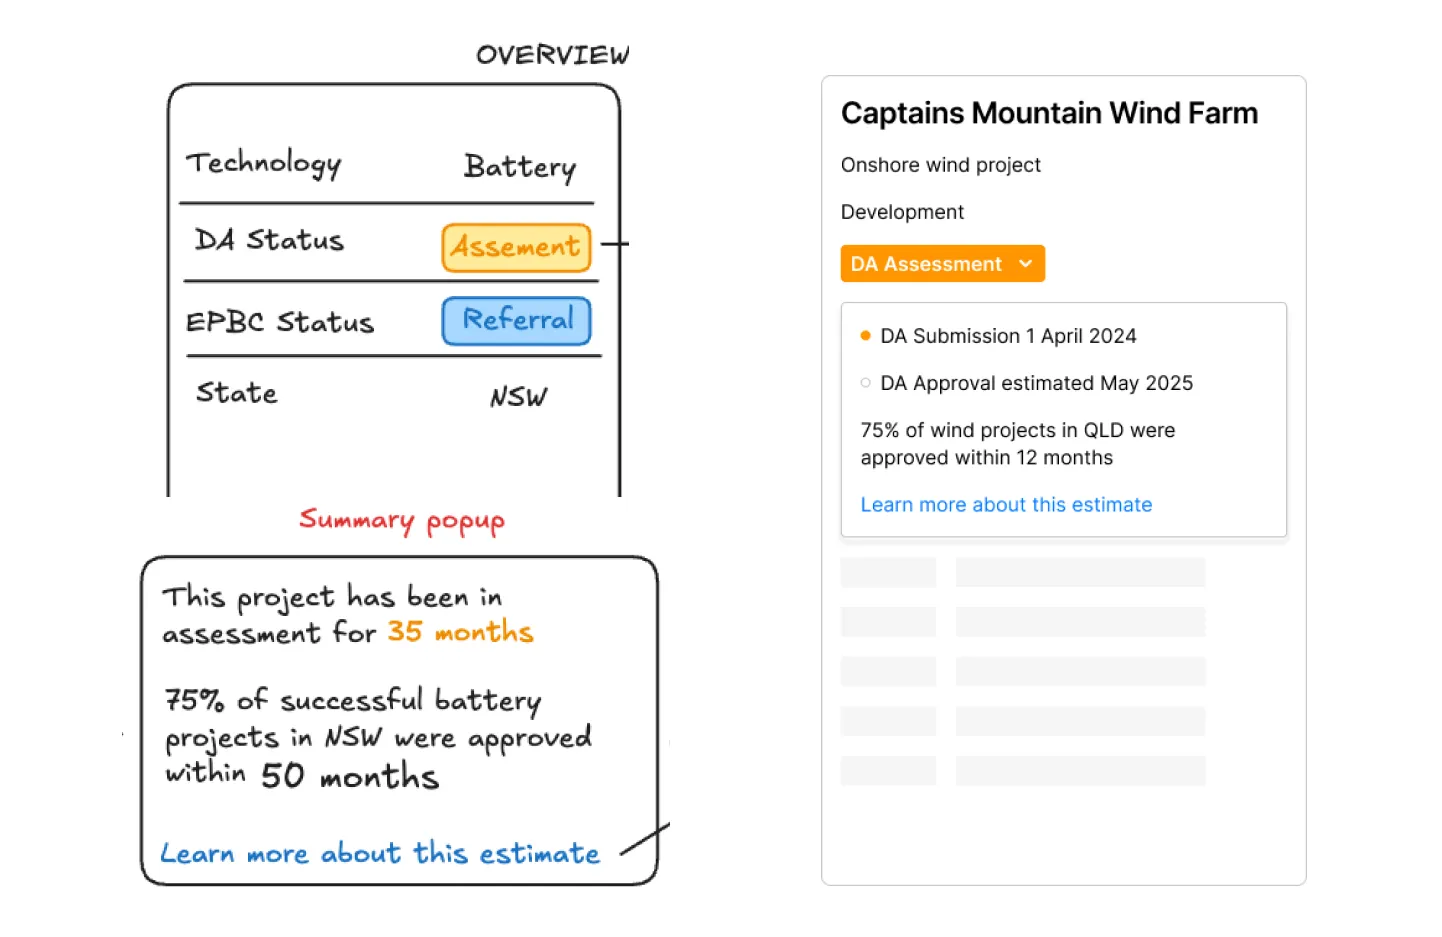
With humble approval estimate mockup in hand, we gathered the first round of feedback on customer calls.
The reactions were positive. People wanted to know when a project was likely to be approved. Buoyed on by the response, we cut a first draft of the approval estimates in product.
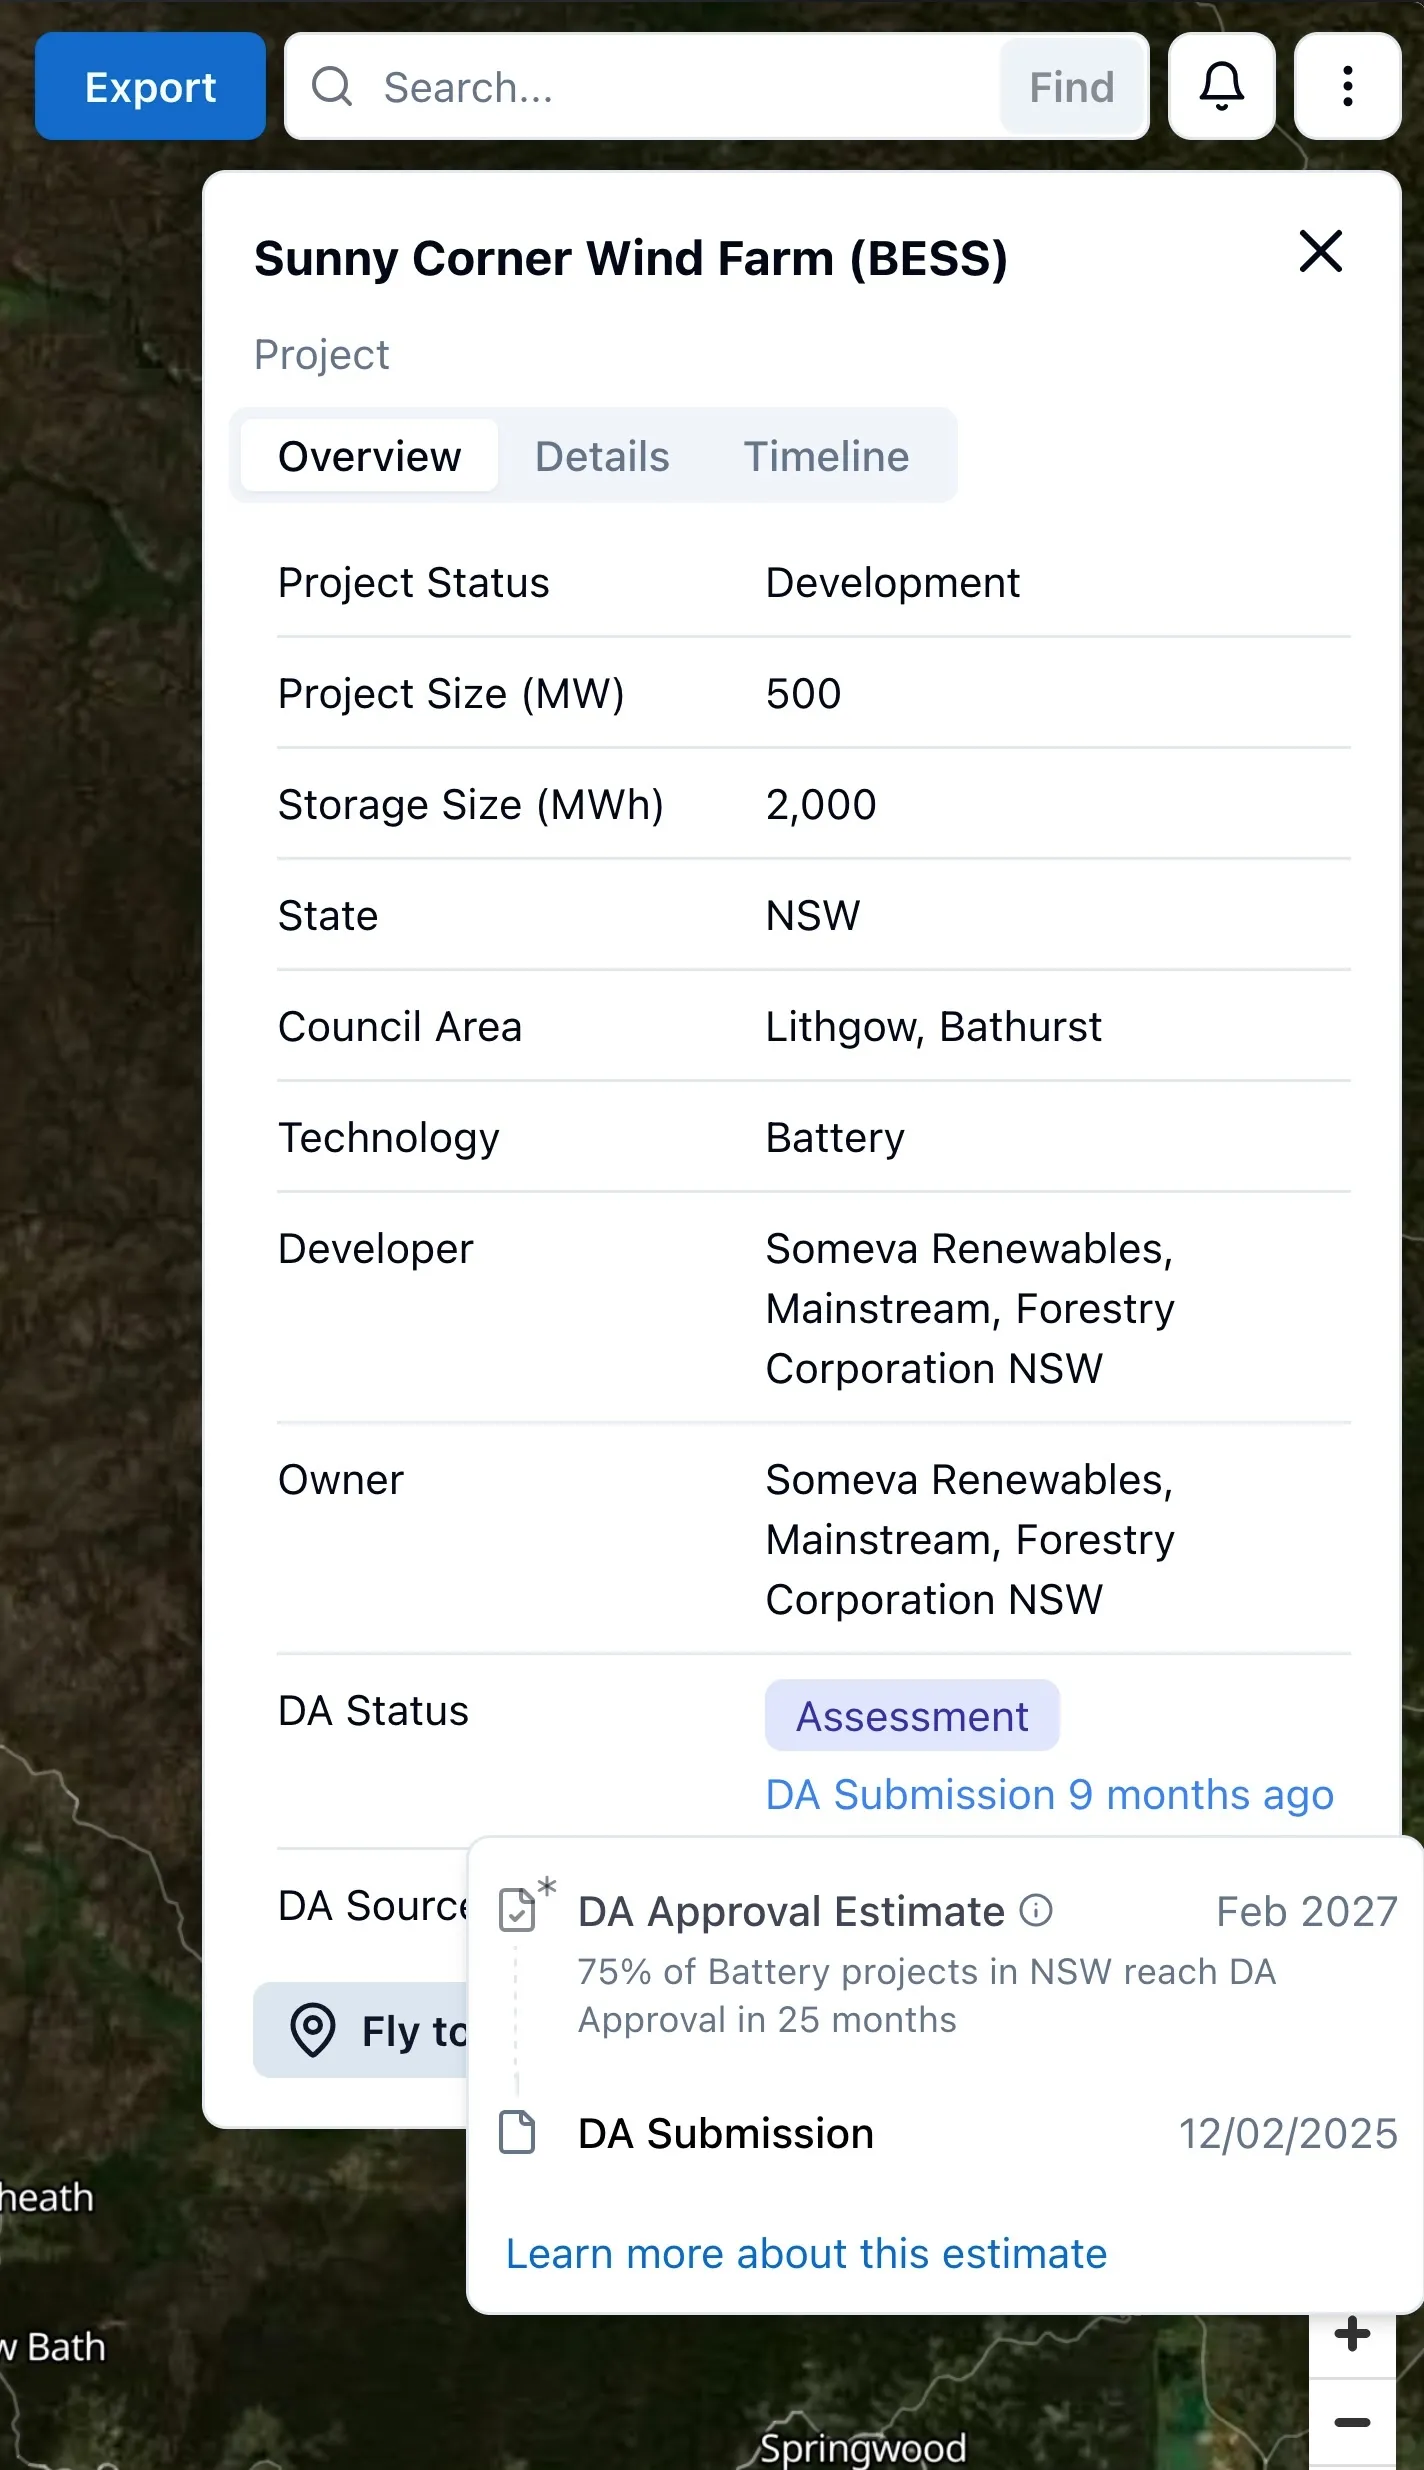
When hovering over a project's DA or EPBC status, the approval estimate was shown in a pop-up. Future approval estimates were added in the project timeline panel.
New features in RenewMap are controlled by feature flags. Feature flags provide a way for features to be turned on or off for specific users. We turn on new features for our own team first. And the occasional brave user who's volunteered themselves.
Approval estimates were turned on for our team to test.
Firstly, it was cool to see the data and analysis come to life in the product. Such a quick read on approval dates for a project felt powerful. The teams' gut check of the feature was mixed. Approval estimates for some projects felt right, others didn't.
Back to another round of customer demos with approval estimates.
This time, demoing the feature in RenewMap, reactions were more skeptical. More questions about how DA and EPBC estimates were calculated. More comparisons of RenewMap estimates to people's own expectations for projects. People had a range of objections for why an estimate for a project was off.
We realised a crucial mistake in the solution.
Don't skip the uncertainty
The design did not communicate the uncertainty of approval time frames.
We were very careful with wording: "75% of battery projects in NSW reach DA approval in 25 months". People read this as, "the project is getting DA approval in Feburary 2027".
The estimates were supposed to communicate ranges, but were interpreted as due dates.
We thought approval estimates were the most direct solution for "When will this project get approved?". We had built something that distracted users with poorly communicated data.
Assessment comparisons
We needed a solution that included the uncertainty of approval timeframes. We still believed:
- People want to know when a project will get approved
- Comparing one project's assessment period to similar projects is helpful
- RenewMap is well positioned to help solve this problem
We needed to do it differently:
- Focus on objective data that describes what's happened
- Communicate the uncertainty
- Help people draw their own conclusions, faster
This nudged us toward the idea of an assessment comparison. Highlight current data for a project's assessment period. Compare the current period to similar projects. Include a comparison chart with enough room to show the range of outcomes.
2nd time's a charm
Assessment comparisons were built into two surface areas of the product.
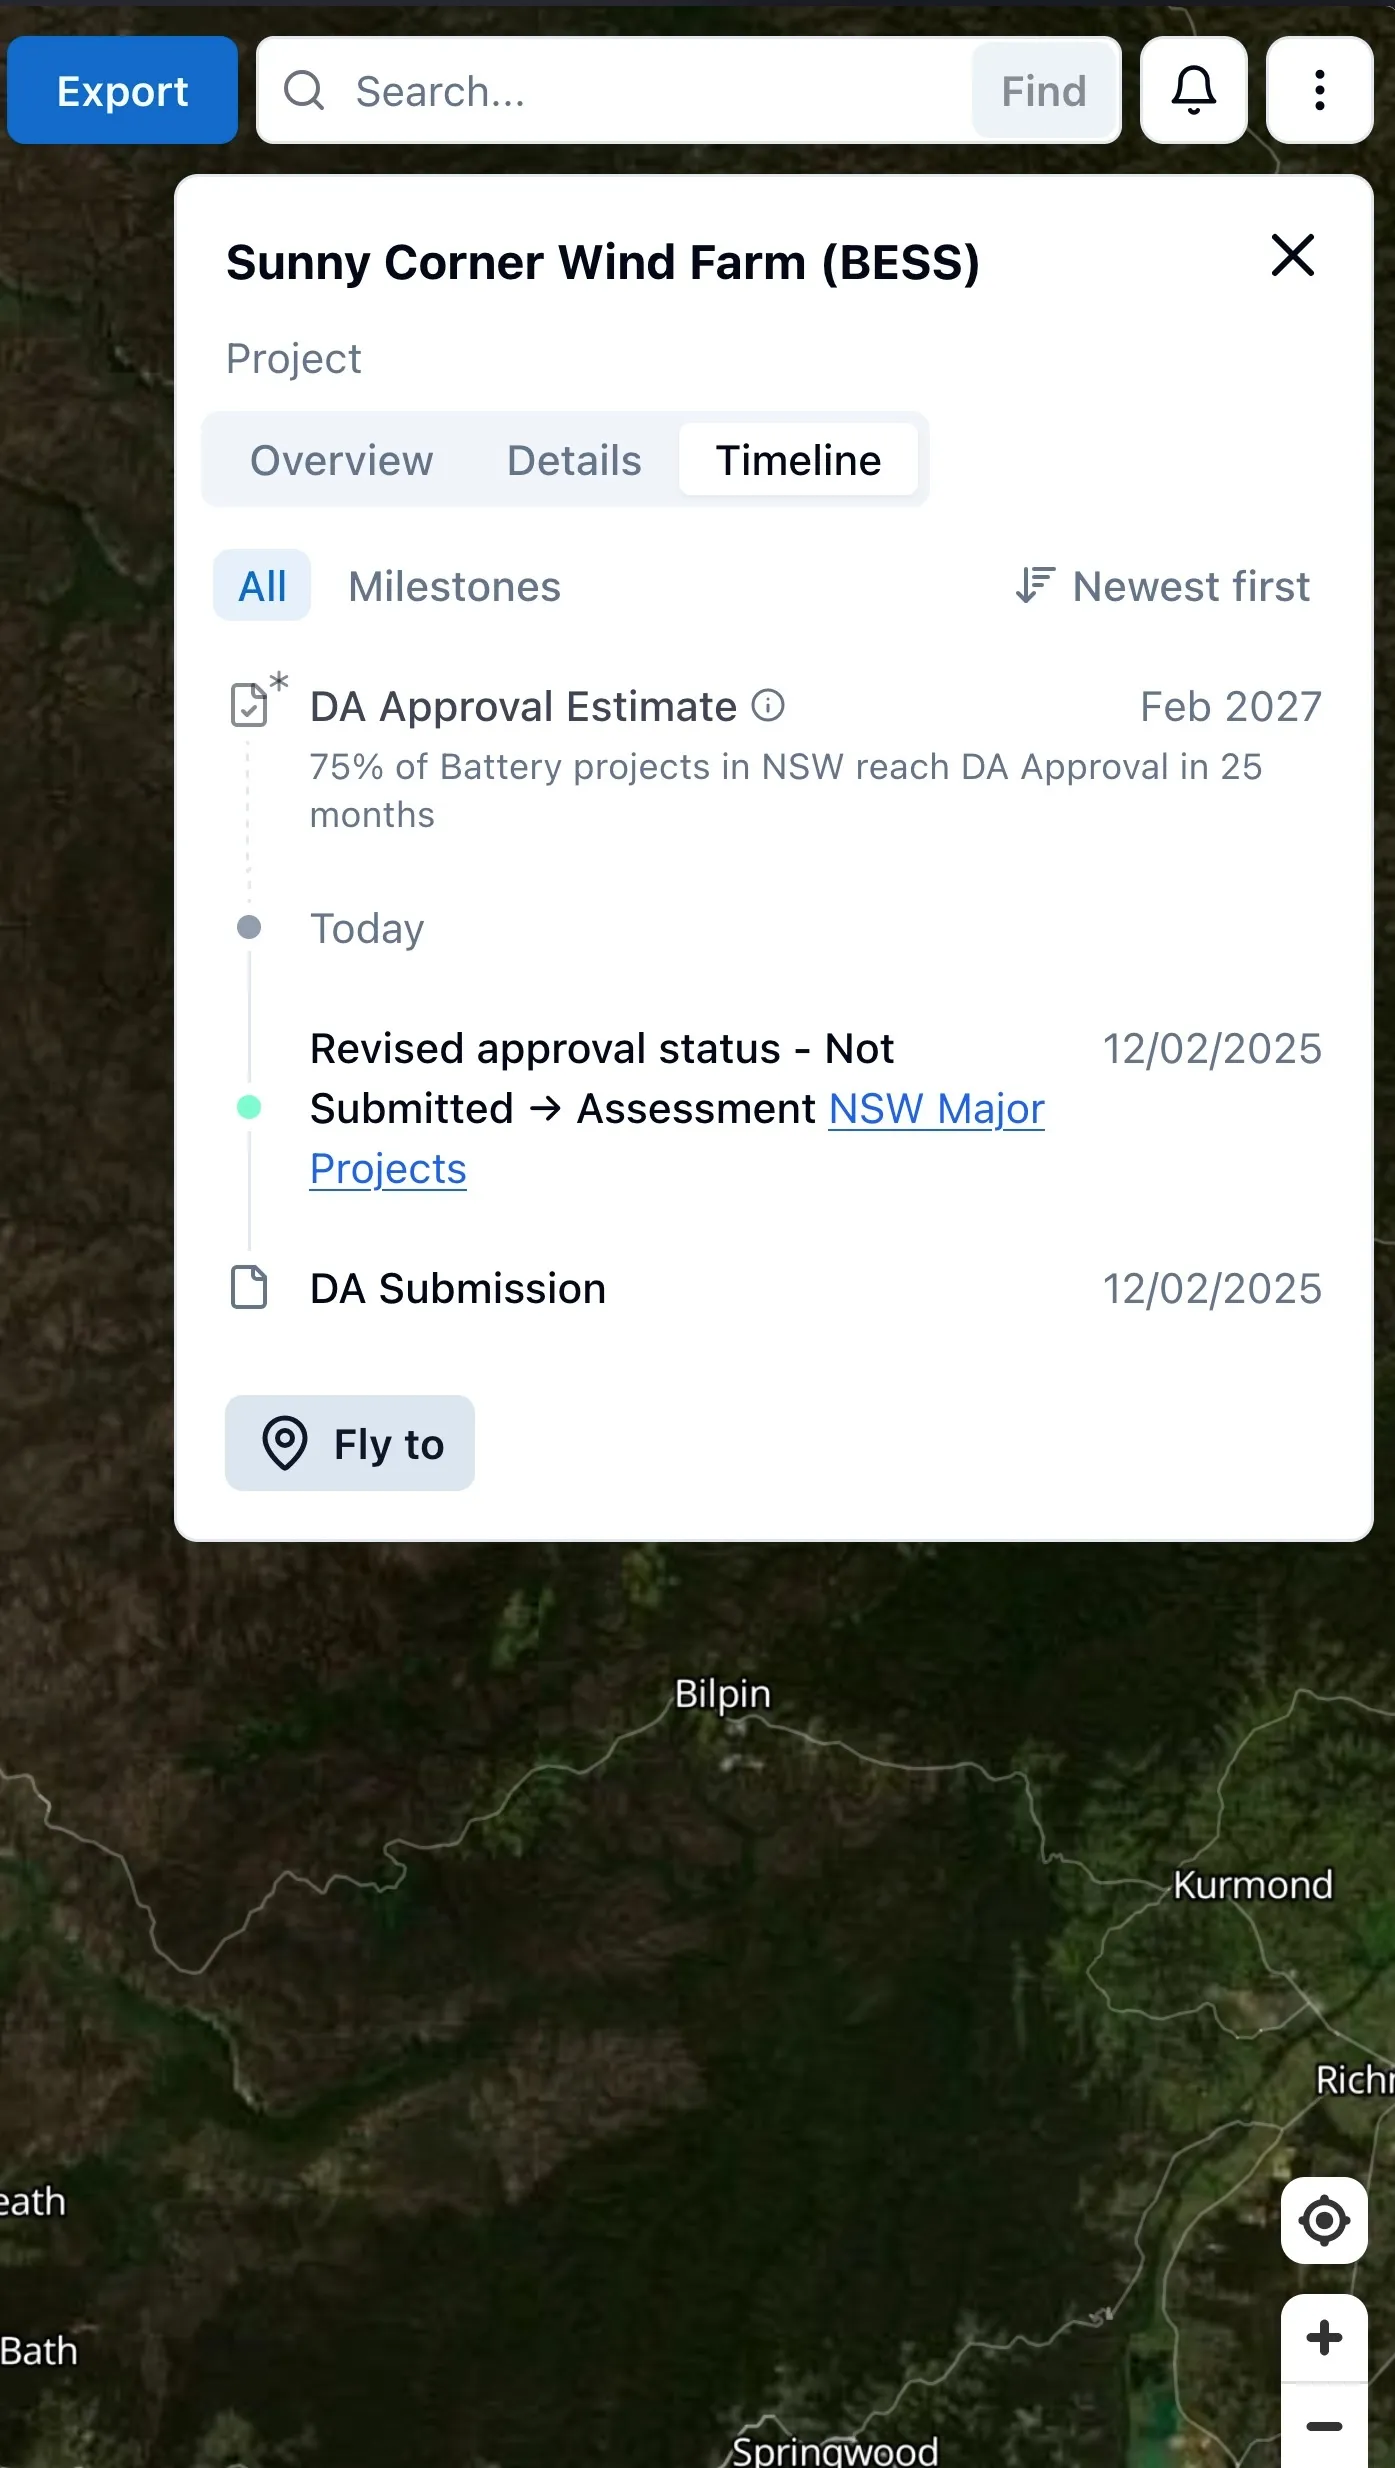
In progress DA and EPBC assessments were highlighted on the timeline tab. No more estimated dates in the future. A note shows if the assessment period is longer or shorter than similar projects.
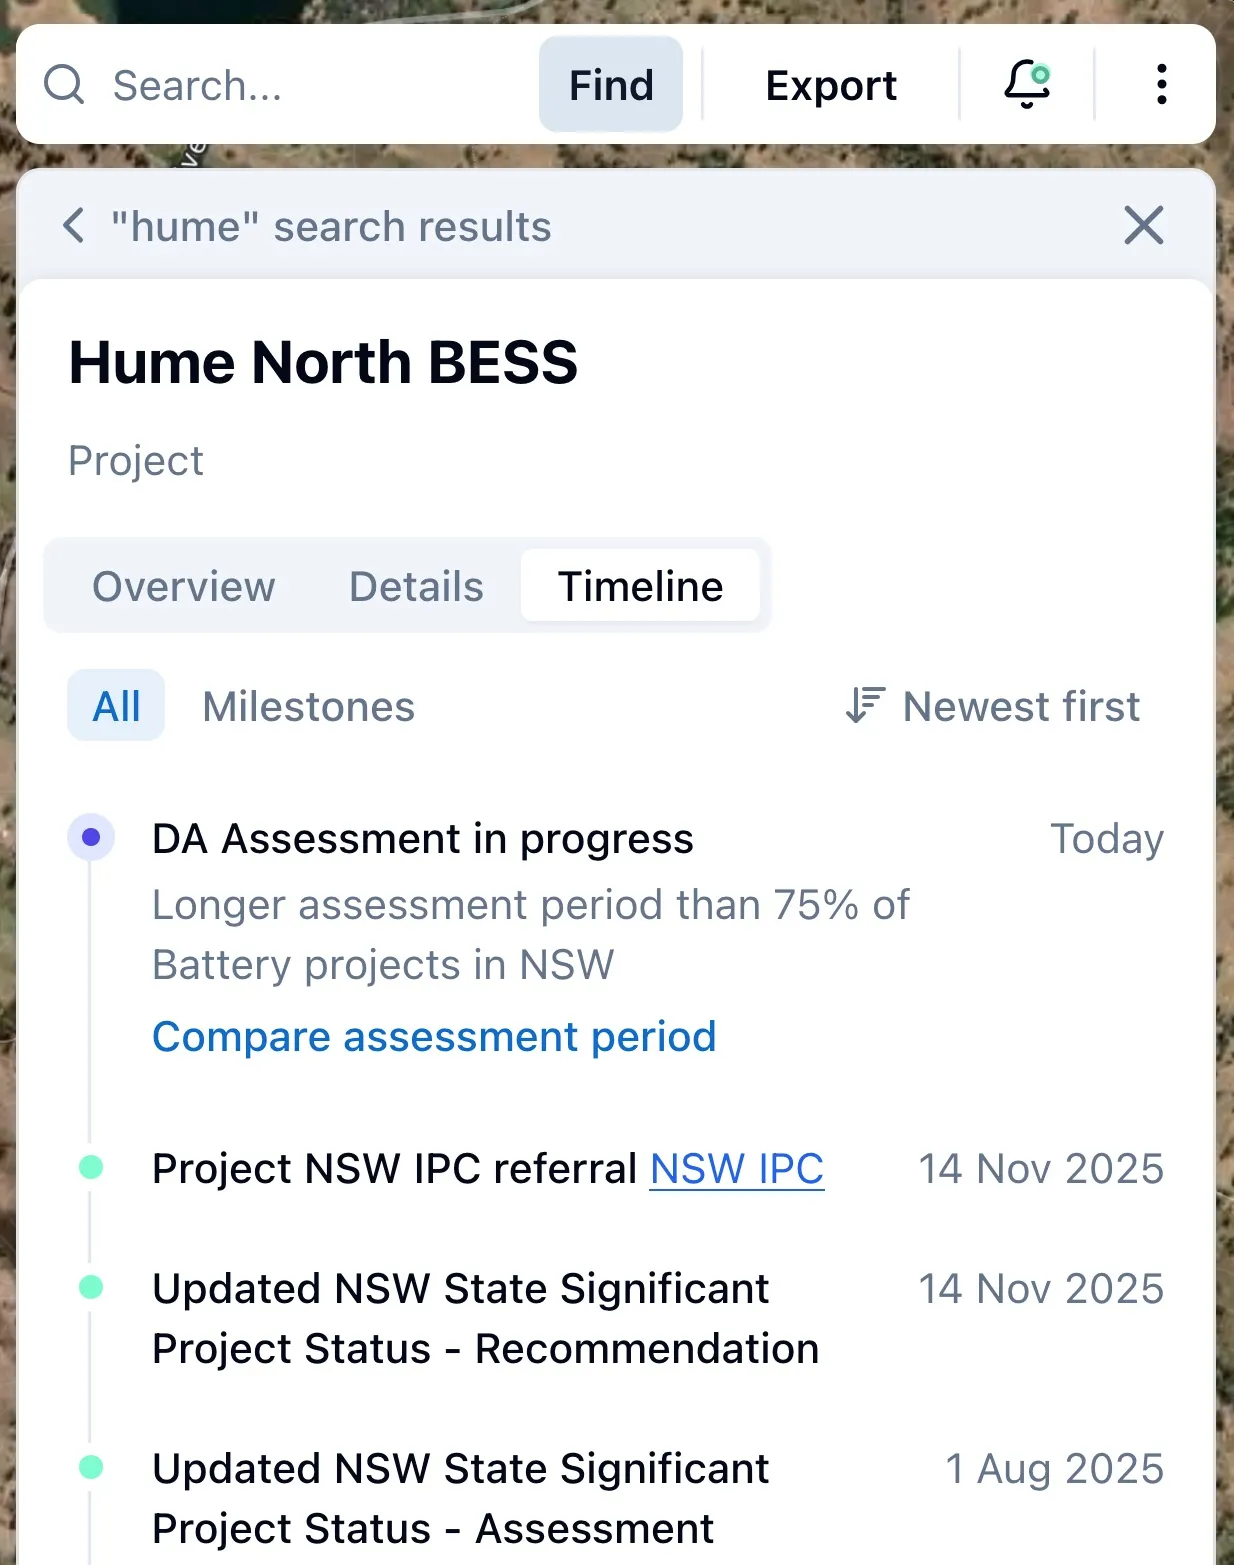
Clicking "Compare assessment period" opens the assessment comparison chart. This chart shows how a project's assessment compares to similar projects. The project's DA or EPBC assessment period is plotted next to projects in the same state and technology.
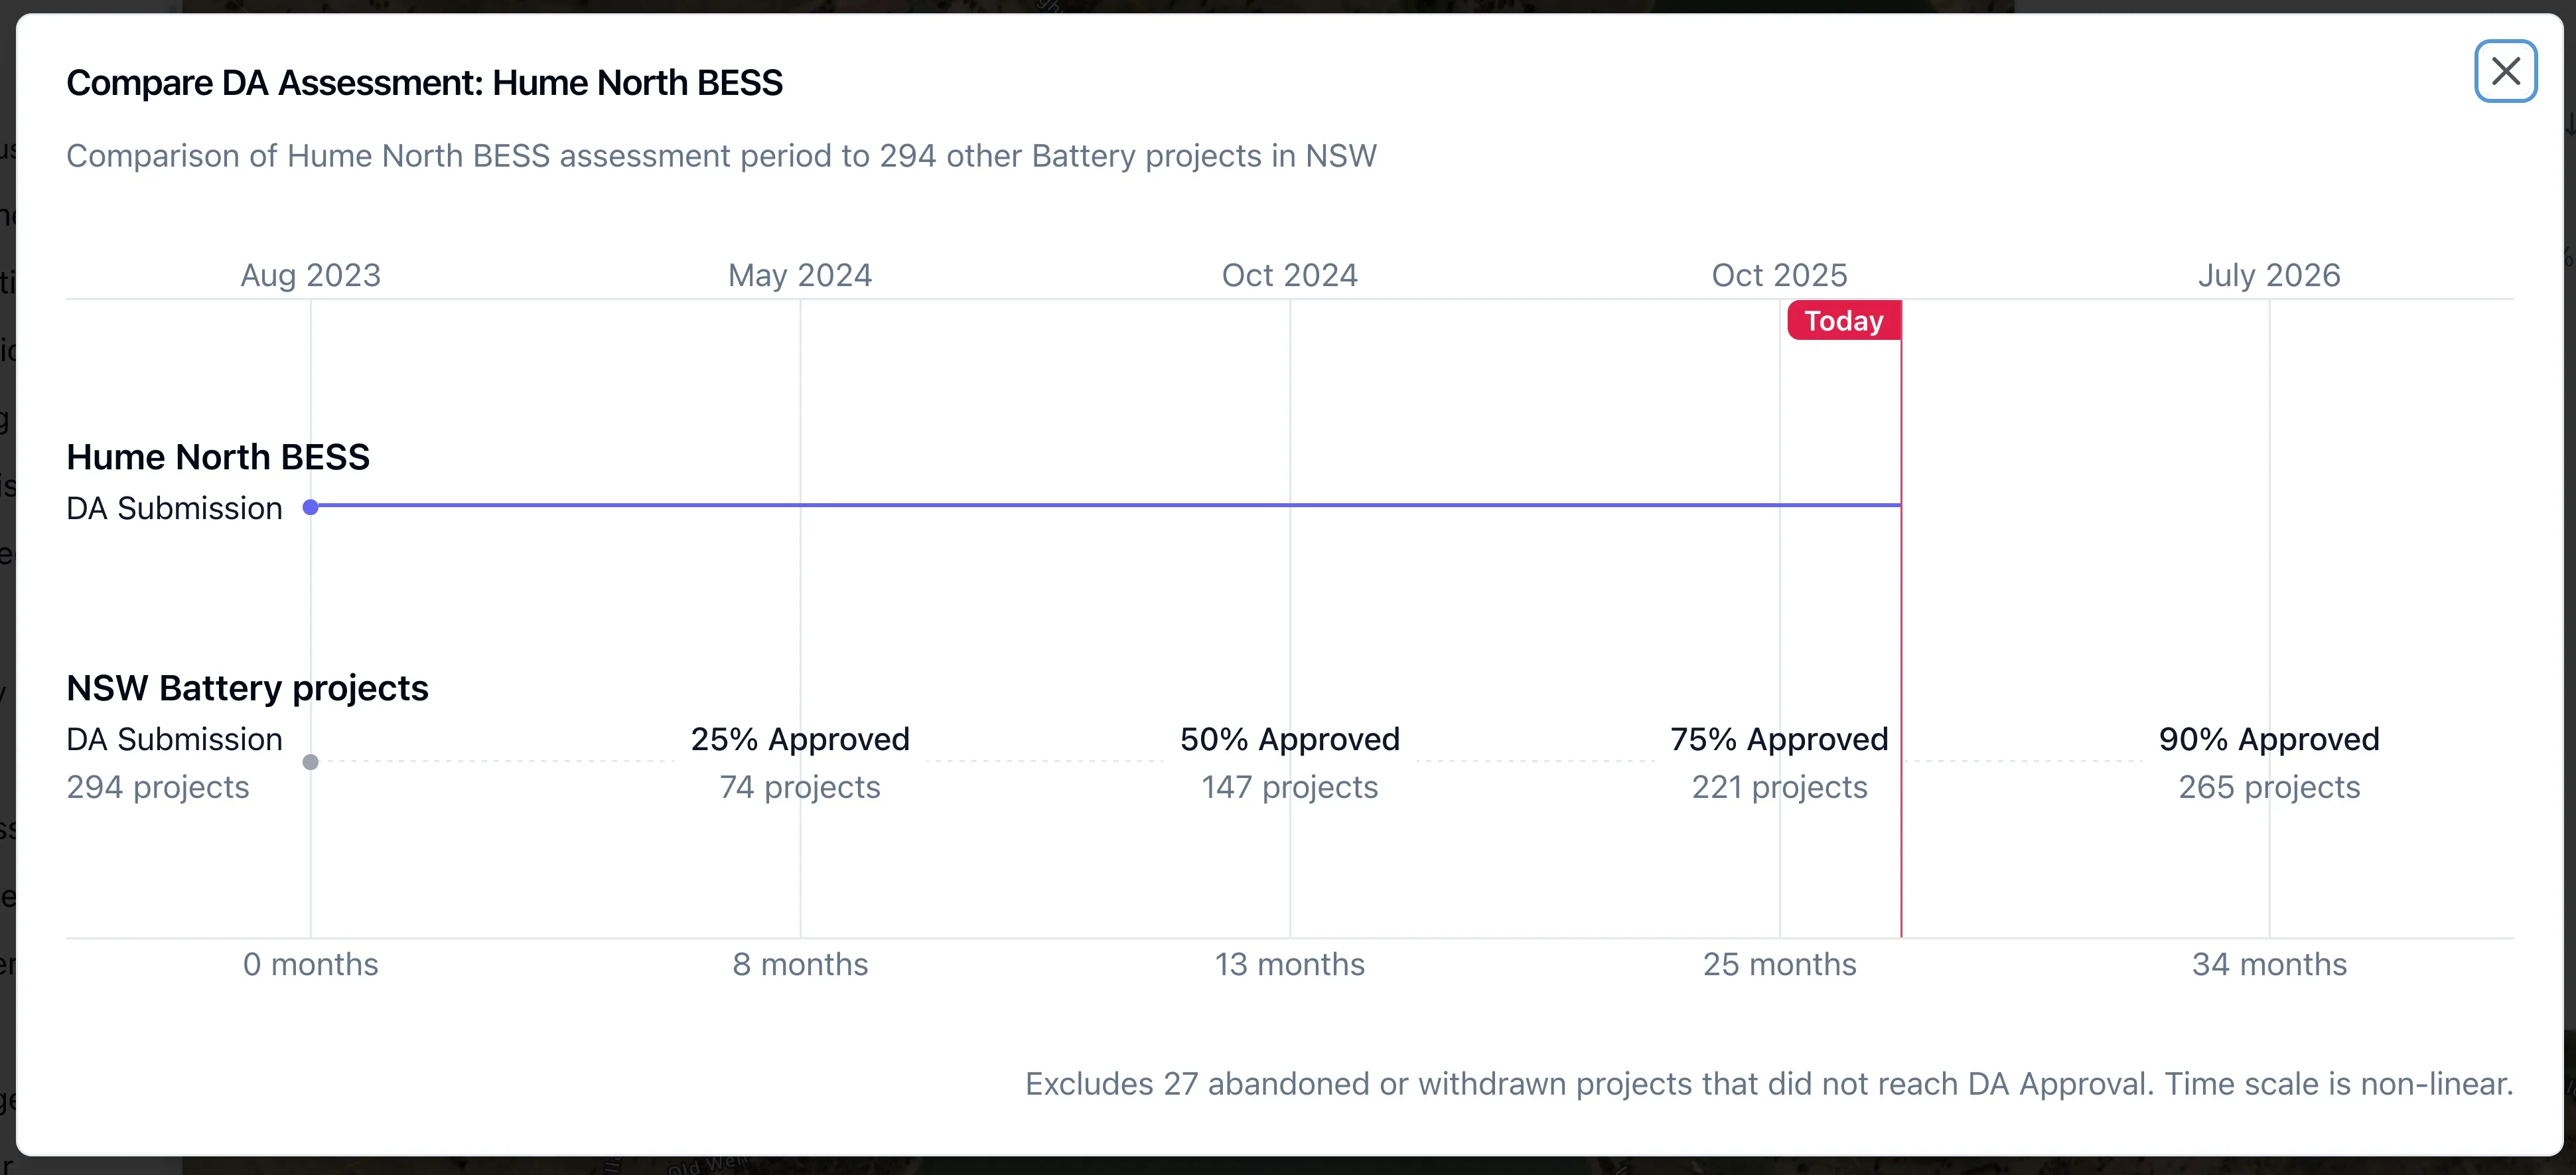
The time range of approvals are easier to read from the chart. Sample size and the number of abandoned projects are also included. More context about the uncertainty of approval timelines.
This iteration tested much better within the team. Assessment comparisons even snuck into a few of Alex's demo calls. When unreleased features get a run on demo calls, we're on the right track.
We hit the button and assessment comparisons went live for everyone.
Assessments compared
Assessment comparisons were well received! Since releasing in August 2025:
- 15% of RenewMap users look at a comparison chart every month
- 300 different projects have had their assessment comparison viewed
- 2 superusers have checked out comparisons for more than 50 projects each
I'm happy with assessment comparisons so far. There's a couple more iterations up the sleeve too. So keep an eye out for that.
Finding the rhythm
RenewMap customers need to make complicated decisions, fast. We feel that tension in product development. Build features for quick insight, necessarily discarding detail. Build features that lay data bare, leaving more legwork.
Approval estimates removed the uncertainty of approval timelines. Assessment comparisons were the realisation more detail was needed.
Back and forth. That's part of the fun. That's the rhythm of product development.
…
If you're a customer wanting to get in on the fun, look out for a discovery call invite. Or put your hand up at [email protected]
If you're a software engineer and that sounded like your kind of fun, we'd love to talk. Say hello at [email protected]