Not all renewable projects are created equal: Why approval times vary dramatically across Australia

Navigating approvals is a critical part of any renewables project, but it can be a long and risky process.
Environmental approval under the EPBC Act may take only a few months, but for some projects this stretches to 5+ years. Planning approvals similarly can take anywhere from 6 to 60 months. And this variation isn't random - it depends heavily on where you build and what technology you choose.
Understanding these approval timeline differences is crucial for developers, investors, and policymakers as Australia accelerates its clean energy transition. That's why RenewMap analysed our industry-leading projects database to assess the development outlook across different states and technologies.
We looked at 875 historical development/planning applications and 641 EPBC approval applications and found clear patterns in development timeframes that could reshape how and where renewable projects are planned.
The Big Picture: Technology Matters for Approvals
Different renewable technologies face fundamentally different approval challenges, and this shows up clearly in the data. The chart below shows expected processing timeframes for different technologies, with 'other' encompassing Biogas, Biomass, Distillate, Gas, Geothermal, Hydro, Hydrogen, Pumped Hydro, and Solar Thermal projects.
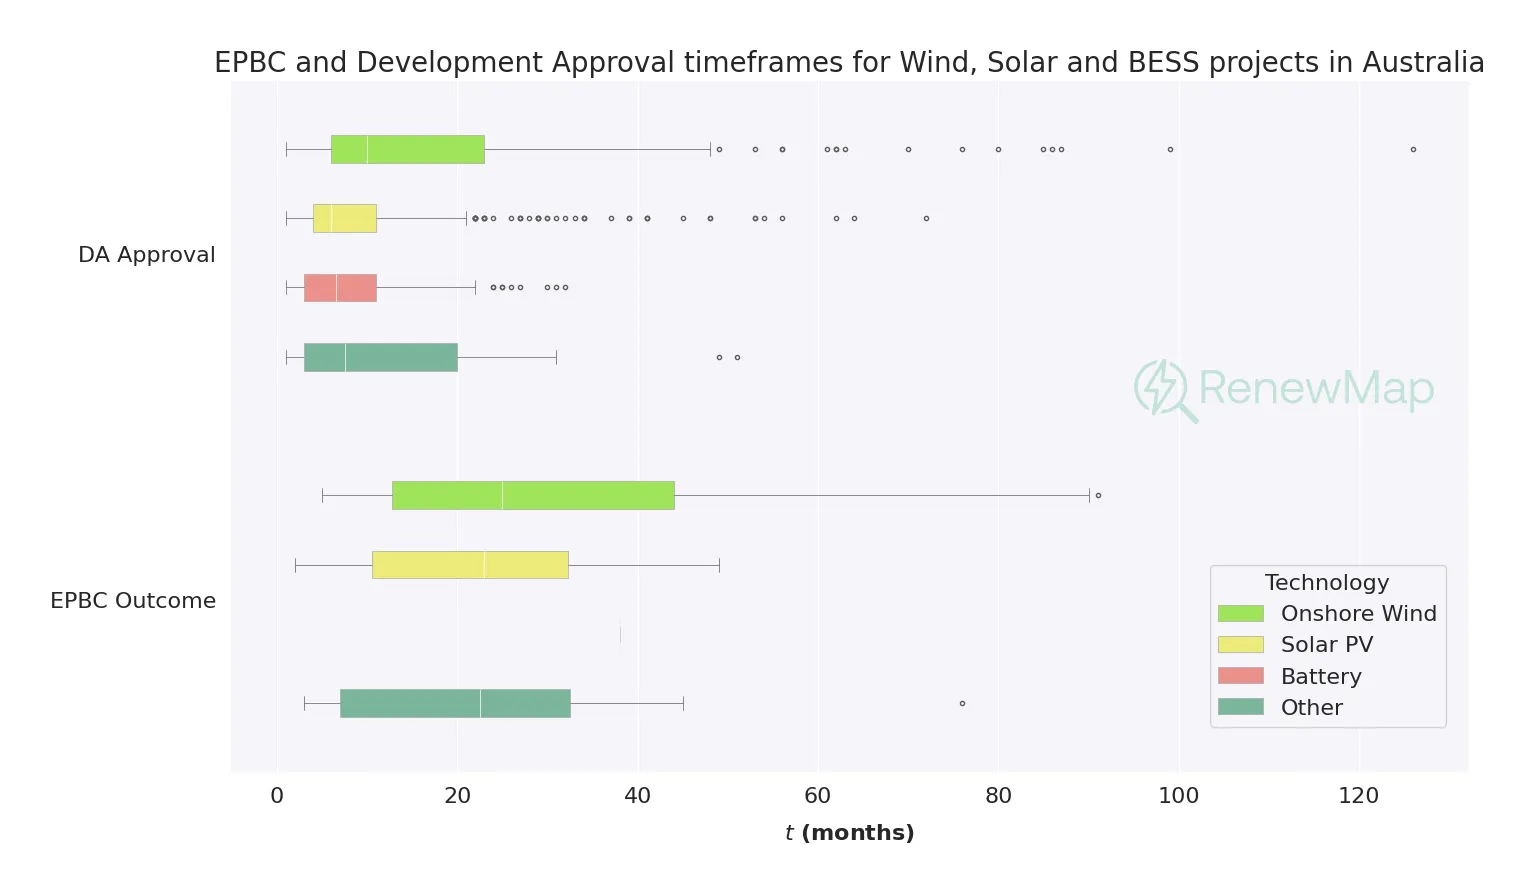
Across our analysis, solar farms typically have the shortest development approval cycles. With relatively straightforward environmental impacts and established regulatory pathways, 40% of utility-scale solar projects get a development approval within 6 months, and most can expect to have a planning permit approved within 16 months. Meanwhile, the average EPBC approval timeframe for solar projects is 8 months, with approximately 60% of solar projects being assessed as a 'non-controlled action', eliminating the need for a lengthy environmental assessment and controls pathway.
Onshore wind projects face greater approval complexity. A large project footprint, more intensive environmental studies for bird and bat impacts, and often more complex community consultation processes are some of the factors that developers need to negotiate. The average timeframe for EPBC approval on an onshore wind project across our dataset was 17 months - more than twice that of a solar project. And only 20% of projects can expect to get development planning approval within 6 months, with the average timeframe being 34 months.
Battery storage projects occupy an interesting middle ground. While environmental approvals are often simpler, grid connection requirements and evolving planning regulations can extend approval timelines. The average EPBC approval timeframe for batteries was 12 months, while a development application takes 14 months on average.
| Technologies | n | < 6 months | Mean | Median |
|---|---|---|---|---|
| Onshore Wind | 261 | 20% | 34 months | 14 months |
| Solar PV | 601 | 42% | 16 months | 8 months |
| Battery | 543 | 40% | 14 months | 9 months |
| Technology | n | 0 days (ie non-controlled action) | < 6 months | Mean | Median |
|---|---|---|---|---|---|
| Onshore Wind | 250 | 43% | 51% | 17 months | 6 months |
| Solar PV | 161 | 63% | 70% | 8 months | 0 months |
| Battery | 168 | 43% | 57% | 12 months | 4 months |
State of Origin: NSW lags behind
The story doesn't end there. Australia's federal system means renewable developers must navigate different regulatory environments in each state, and this creates significant variations in approval speed.
New South Wales emerges as the most complex regulatory environment to undertake a renewables project. In this state, EPBC outcomes for onshore wind projects take on average 25 months, longer than the national average for wind by 8 months, while 22% of wind projects are assessed as non-controlled actions, compared to 43% across the nation. Meanwhile only one third of wind projects in NSW get an EPBC approval within 6 months, compared to 50% in the national average. Planning approvals on wind projects take longer in this state too. Across 83 approved projects that we analysed for NSW, the average development application took 47 months, higher than the national average by 14 months.
The picture is similar in NSW for Solar and battery projects as well, with both of those technologies taking longer to get both EPBC and planning approval.
Queensland offers historically faster approvals pathways. For wind projects, the average timeframe for a planning approval was 25 months faster than the national average, with the median timeframe being 8 months faster. Interestingly, relatively few wind projects in Queensland have been assessed under EPBC as non-controlled actions, only 15% compared to 43% across the nation. This is partly due to historical timing - wind in Queensland was relatively sparse back in the early days of the industry, when wind projects were more likely to be waved through EPBC on a non-controlled action. Another factor is the extent and importance of diverse ecologies across Queensland.
Despite the environmental complexities however, EPBC processing is similar or faster in that state compared with the national, with the median timeframe of processing for controlled-action wind farms also being 8 months faster than the national median. This difference was not found to be statistically significant in our analysis however, given the small sample size and the large variance in observed timeframes. Similarly to wind, solar farms and batteries see similar EPBC processing times in Queensland to the national average.
Western Australia may represent a sleeping opportunity for renewables developers. We have fewer data to analyse in that state, with only 15 wind projects having completed an EPBC pathway in our database. However, of those 15, 10 have been assessed as non-controlled action, streamlining the approvals process. Similarly, of 9 wind projects for which we have data on planning approvals in Western Australia, the average timeframe was just 9 months, more than 2 years shorter than the national mean of 34 months. However, it is impossible to draw firm conclusions from such a small sample size, and our statistical analysis of the difference in medians below found no significant difference in application timeframes between Western Australia and the national median.
State and technology: survival of the fittest
Combining state and technology reveals the types of projects that travel smoothly through the approval process. As well as types of projects that blow out.
We implemented a Kaplan-Meier survival analysis, broken down into state-technology groups to understand project timeframes picture beyond mean and median estimates. Kaplan-Meier survival analysis is a statistical technique originally developed for medical research to estimate the probability of survival over time. In our context, it estimates the probability that a renewable energy project will reach completion within a given timeframe, accounting for projects that are still in development (called "censored" observations in statistical terms).
This method is particularly valuable for renewable energy analysis because it can handle incomplete data – projects that are still in development don't bias the results. The technique creates survival curves that show the probability of project completion over time, allowing us to identify percentile development times and compare different state-technology combinations. Our analysis is summarised in the charts and tables below.
These charts show:
- Kaplan-Meier event probabilities, which is the complement of the more commonly reported 'survival' probability (i.e. P(event) = 1 - P(survival)).
- In these charts, only groups for which we had a sample size greater than 15 projects are shown.
- The dashed red lines highlight the number of months at which 60% of projects reached completion.
- The shaded bands indicate a 95% confidence interval for a particular percentage estimate.
- The sample size for each group is indicated by the n count in the legend.
Onshore Wind
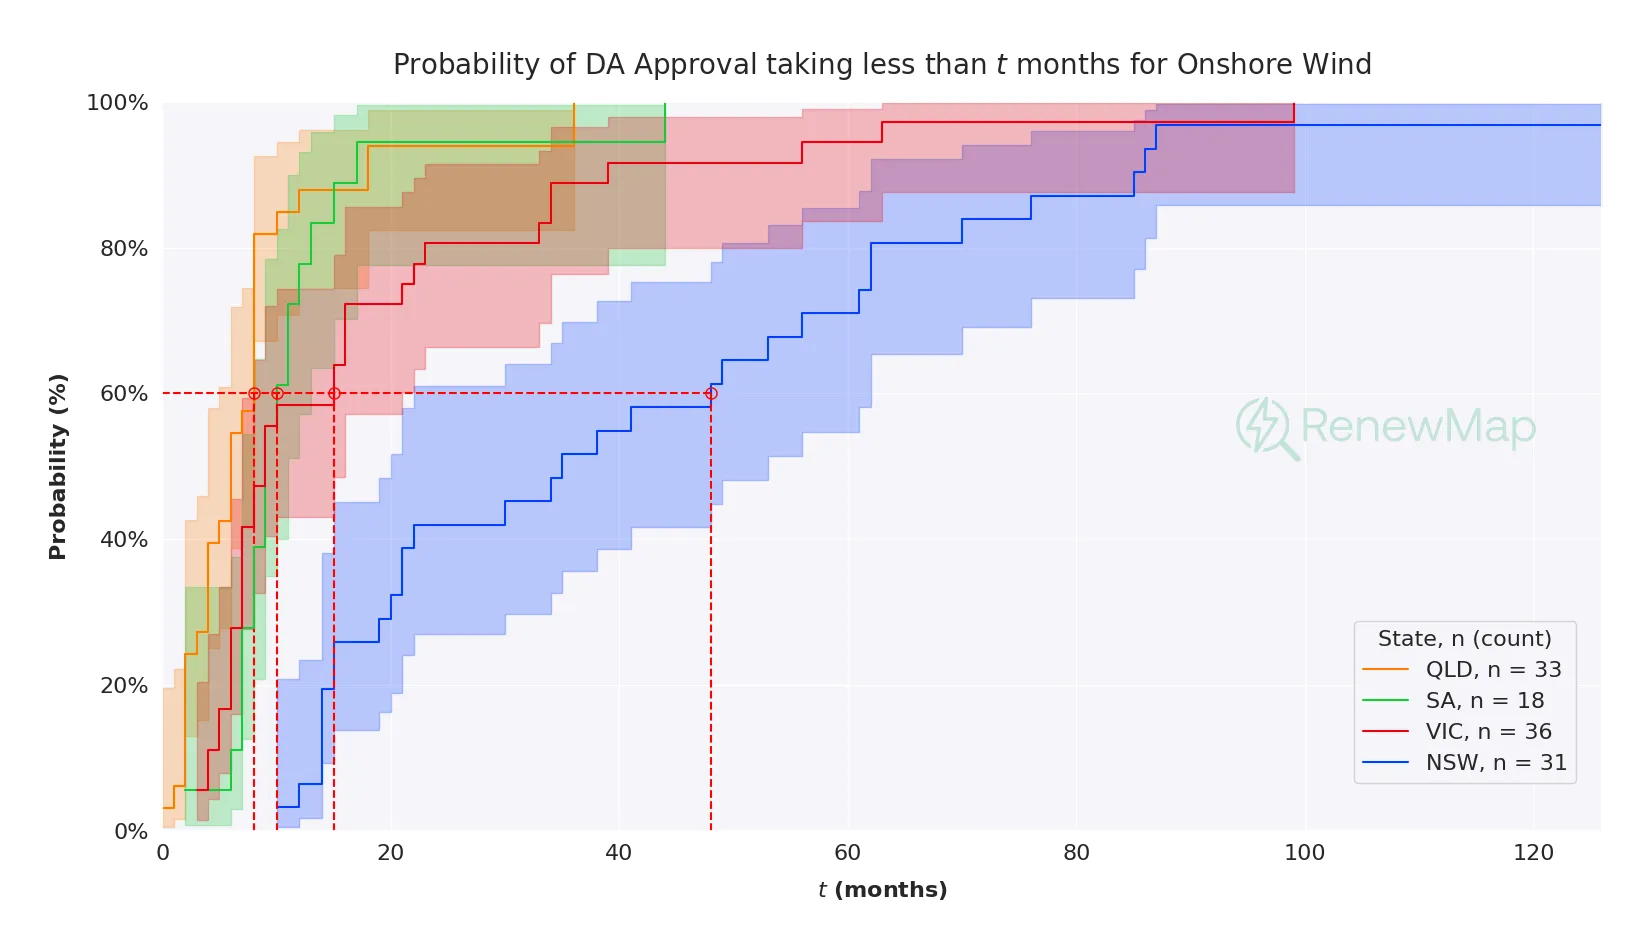
This chart clearly highlights the lengthy approvals time that NSW wind projects face compared to the other analysed states. In NSW, 60% of the analysed projects were completed within ~48 months, compared to ~15 months for Victoria and ~8 months for Queensland.
| % of Onshore Wind projects completed | QLD | SA | VIC | NSW |
|---|---|---|---|---|
| 25% | 3 months | 7 months | 6 months | 15 months |
| 60% | 8 months | 10 months | 15 months | 48 months |
| 90% | 18 months | 17 months | 39 months | 85 months |
Solar PV
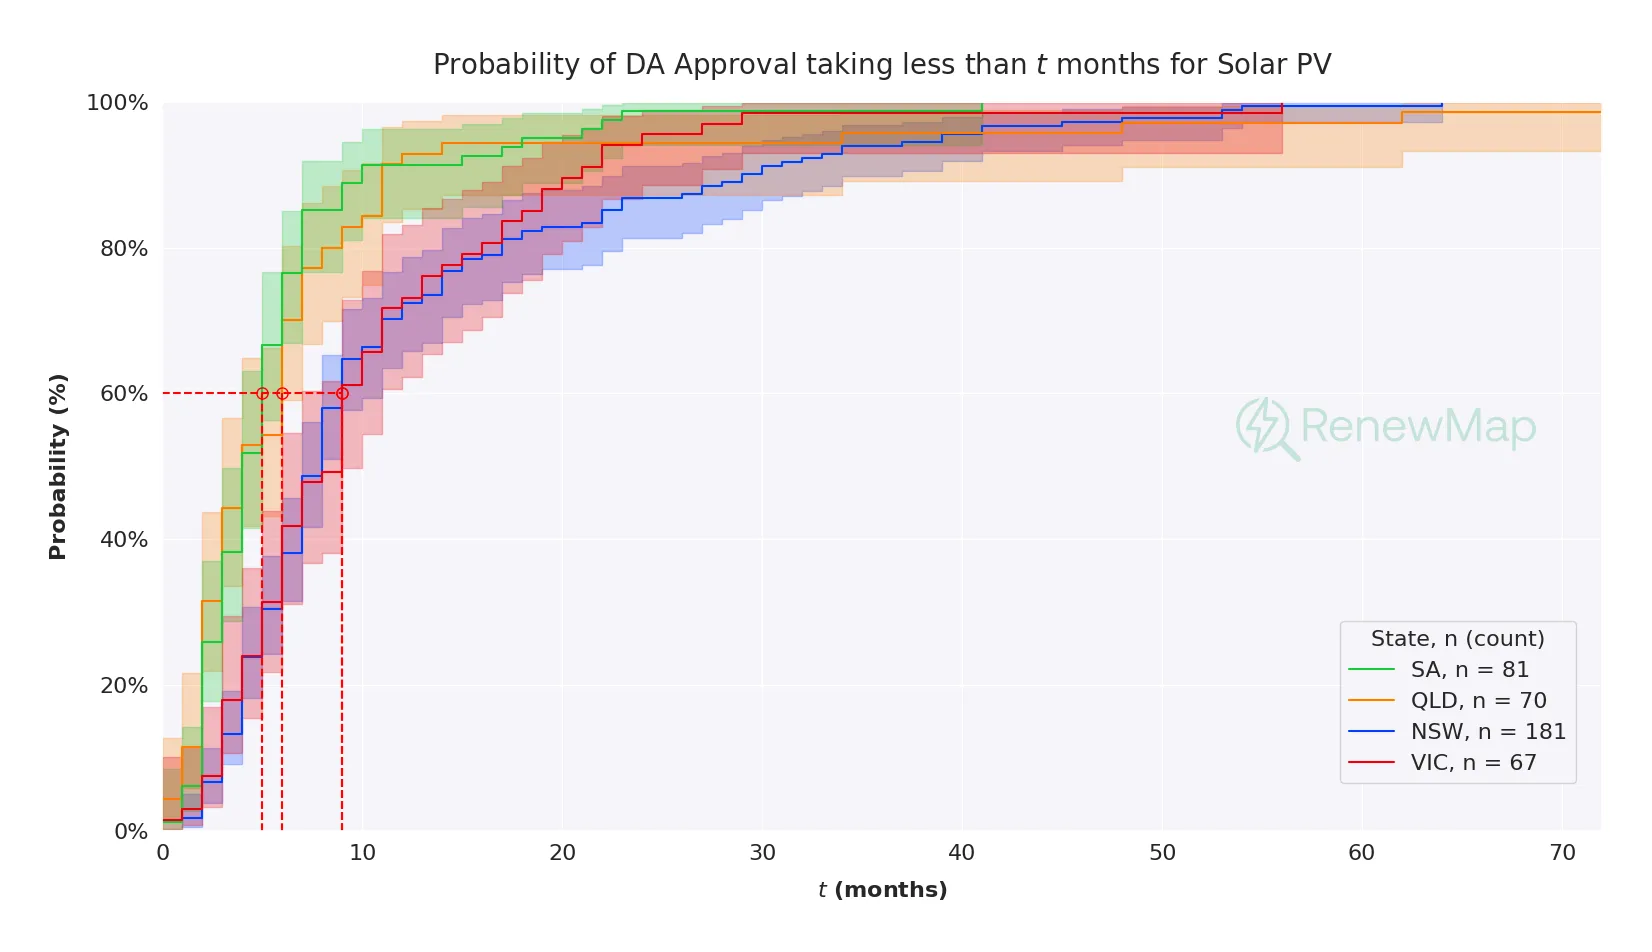
| % of Solar projects completed | SA | QLD | NSW | VIC |
|---|---|---|---|---|
| 25% | 2 months | 2 months | 5 months | 5 months |
| 60% | 5 months | 6 months | 9 months | 9 months |
| 90% | 10 months | 11 months | 29 months | 21 months |
Battery
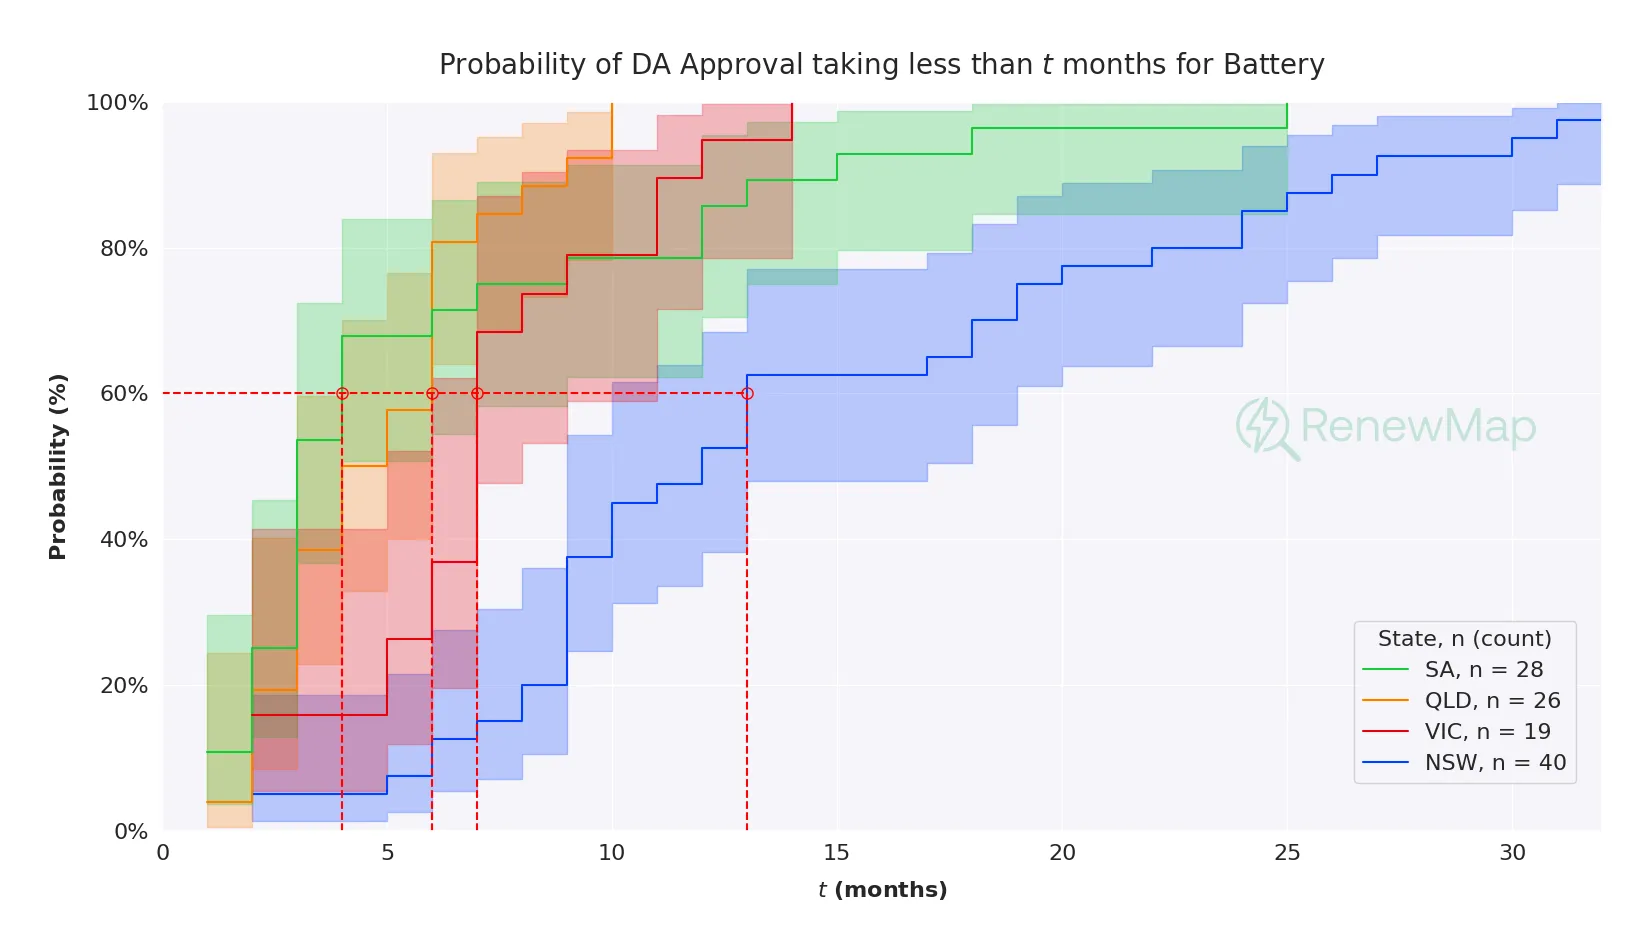
| % of Battery projects completed | SA | QLD | VIC | NSW |
|---|---|---|---|---|
| 25% | 2 months | 3 months | 6 months | 5 months |
| 60% | 6 months | 4 months | 7 months | 13 months |
| 90% | 15 months | 10 months | 20 months | 34 months |
Staying Ahead of a Changing Landscape
While our analysis provides valuable insights into current approval patterns, it's crucial to keep an eye on the evolving regulatory and political environment. Recent developments demonstrate how quickly the landscape can shift.
For example, Queensland has just announced a policy shift that will have deep implications for development application processing timeframes. The new policy introduces stricter policies for wind and large-scale solar farms, emphasising community engagement and social impact assessments.
Meanwhile, Victoria has announced ambitious renewable energy targets of 65% by 2030 and 95% by 2035, significantly raising the stakes for project delivery timelines. These policy shifts can fundamentally alter approval processes, resource allocation, and project priorities across different states and technologies.
The key point is that while historical data provides essential insights, the renewable energy approvals landscape is constantly evolving. Developers, investors, and policymakers must balance data-driven planning with adaptive strategies that account for regulatory changes, policy updates, and shifting political priorities. Success in this environment requires not just an understanding current approval patterns, but also attention to the signals that indicate change.
This is where RenewMap can help. We've built a platform that allows you to track the development of projects across Australia, with data across council, state and federal approval pathways. Get updates and alerts in near-real time and stay ahead of the curve with RenewMap.