
Australia's data centre pipeline in RenewMap

There is no shortage of opinion about data centres right now: where they should go, how they should be powered and what they will do to the grid. At RenewMap we track the projects themselves, so rather than add another view, here is what the development pipeline shows as of October 2026.
We have recently worked with a number of media publications like the AFR, the ABC and CNN, digging further into these trends. There's always more in the data than any one story can hold, so here's a closer look at the numbers and some signals we're seeing here at RenewMap.
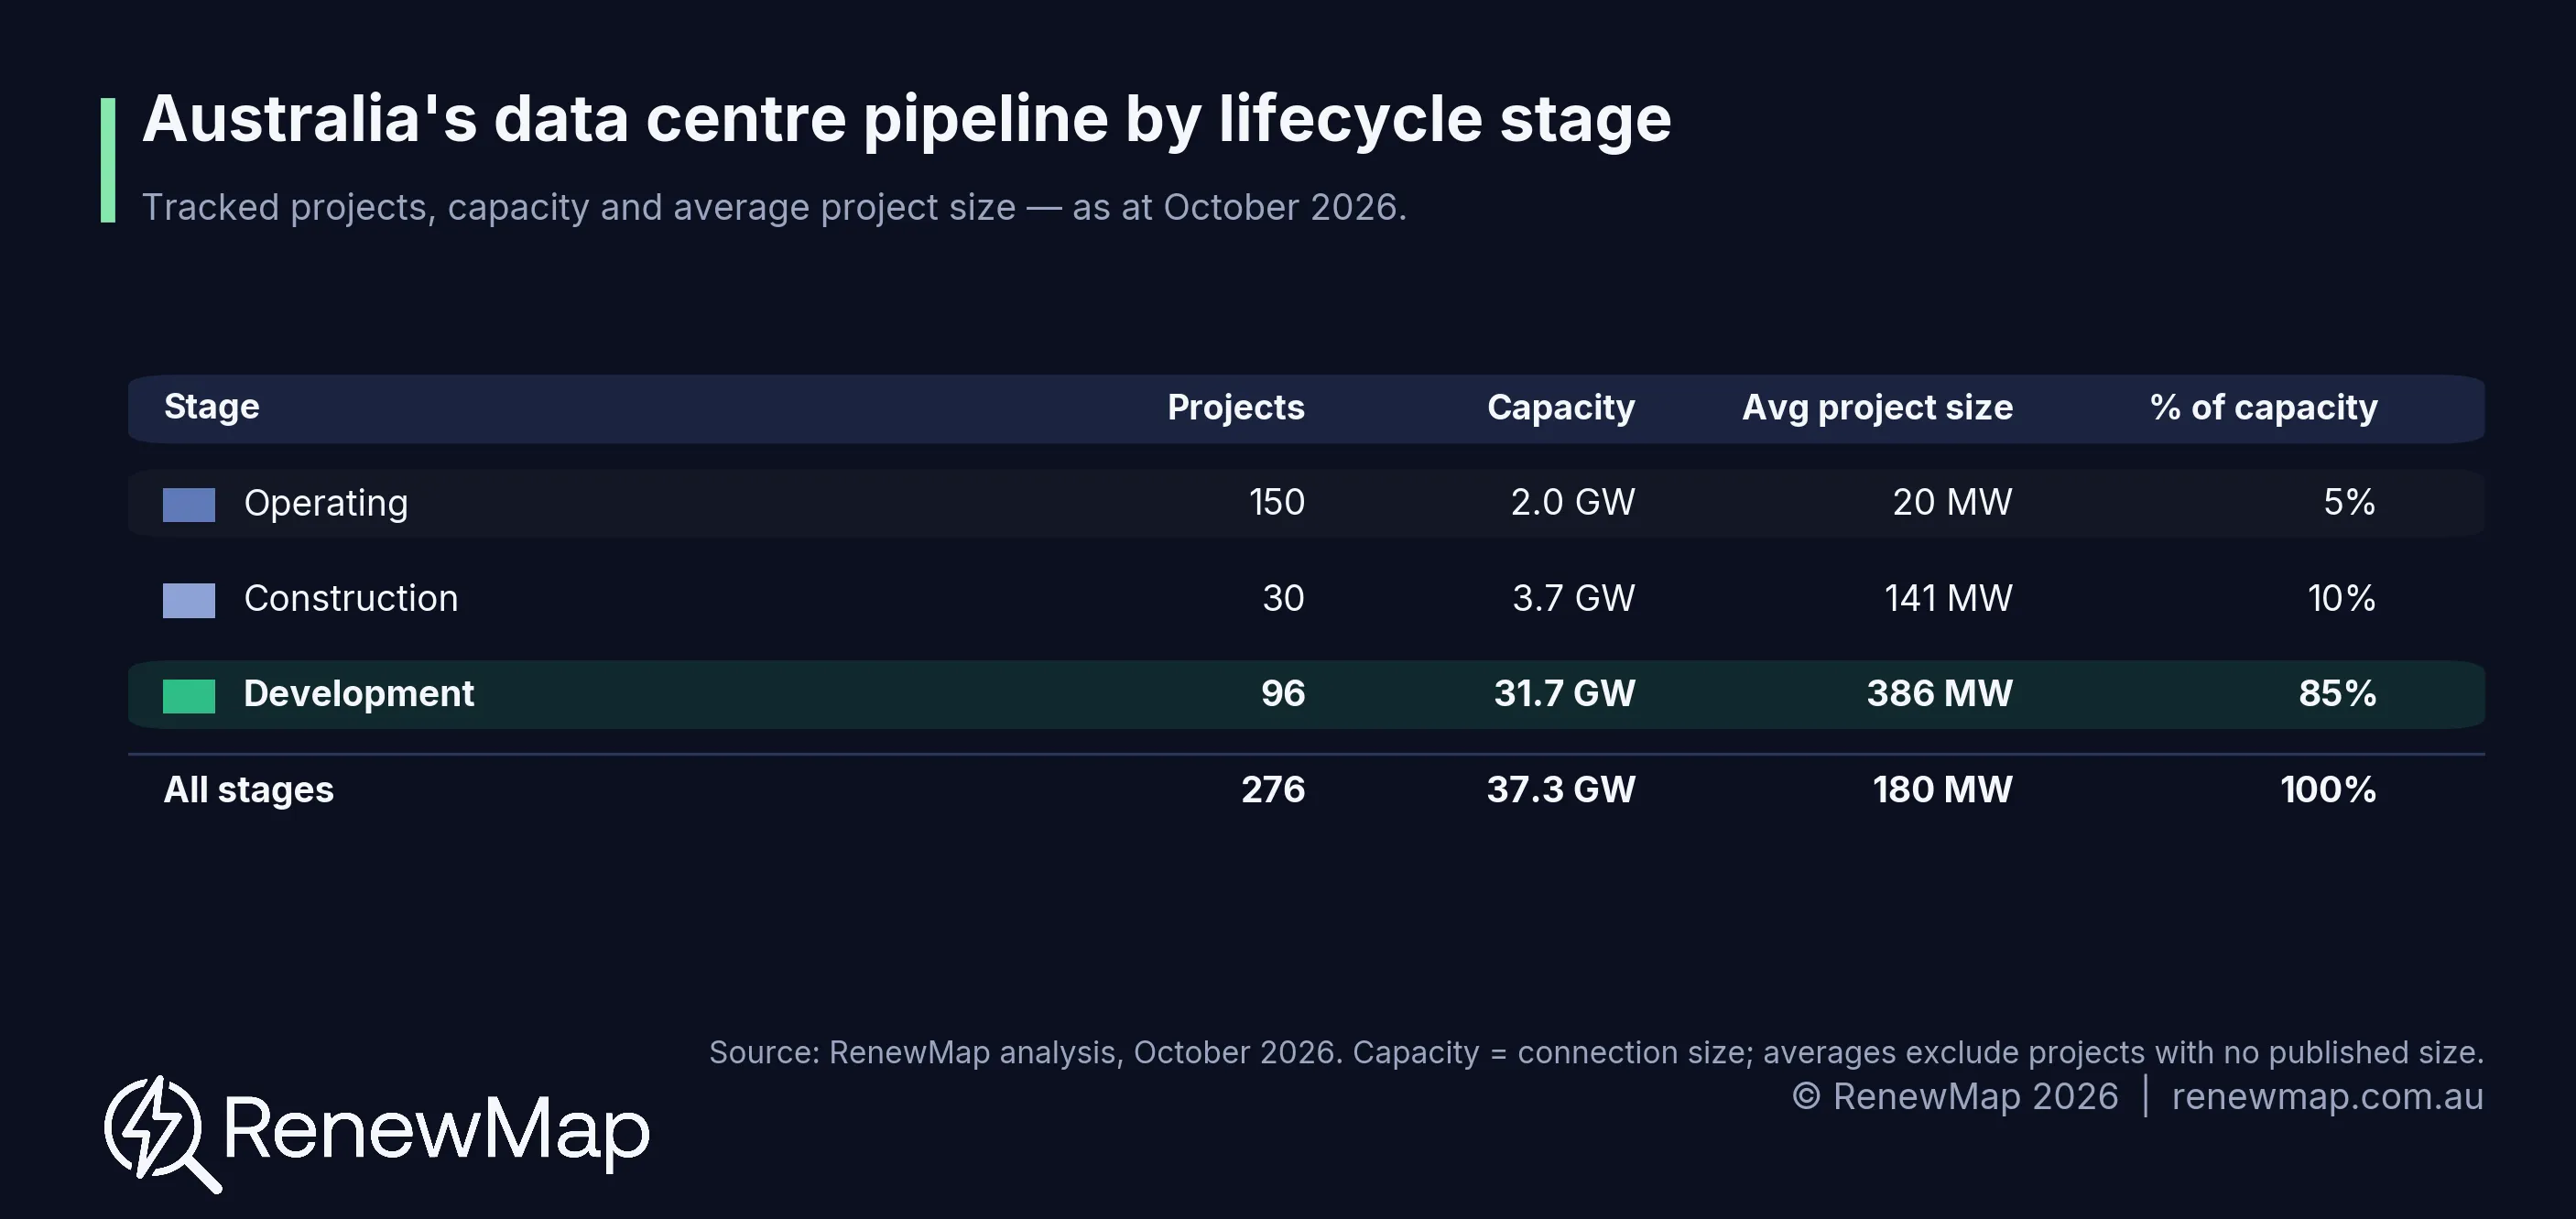
We're currently tracking more than 276 active data centre projects across Australia: 150 operating (about 2 GW), 30 under construction (about 3.7 GW), and 96 in development (about 31 GW). One caveat up front: the project size in megawatts we track is a project's connection capacity, not the IT load it will draw at any one moment, which is lower.
A step change in scale
When we look at the fleet of operating data centres today, the average size sits around 20MW a site. Data centre projects currently under construction are seven times larger on average, and those in the development phase around nineteen times larger in connection size in MW.
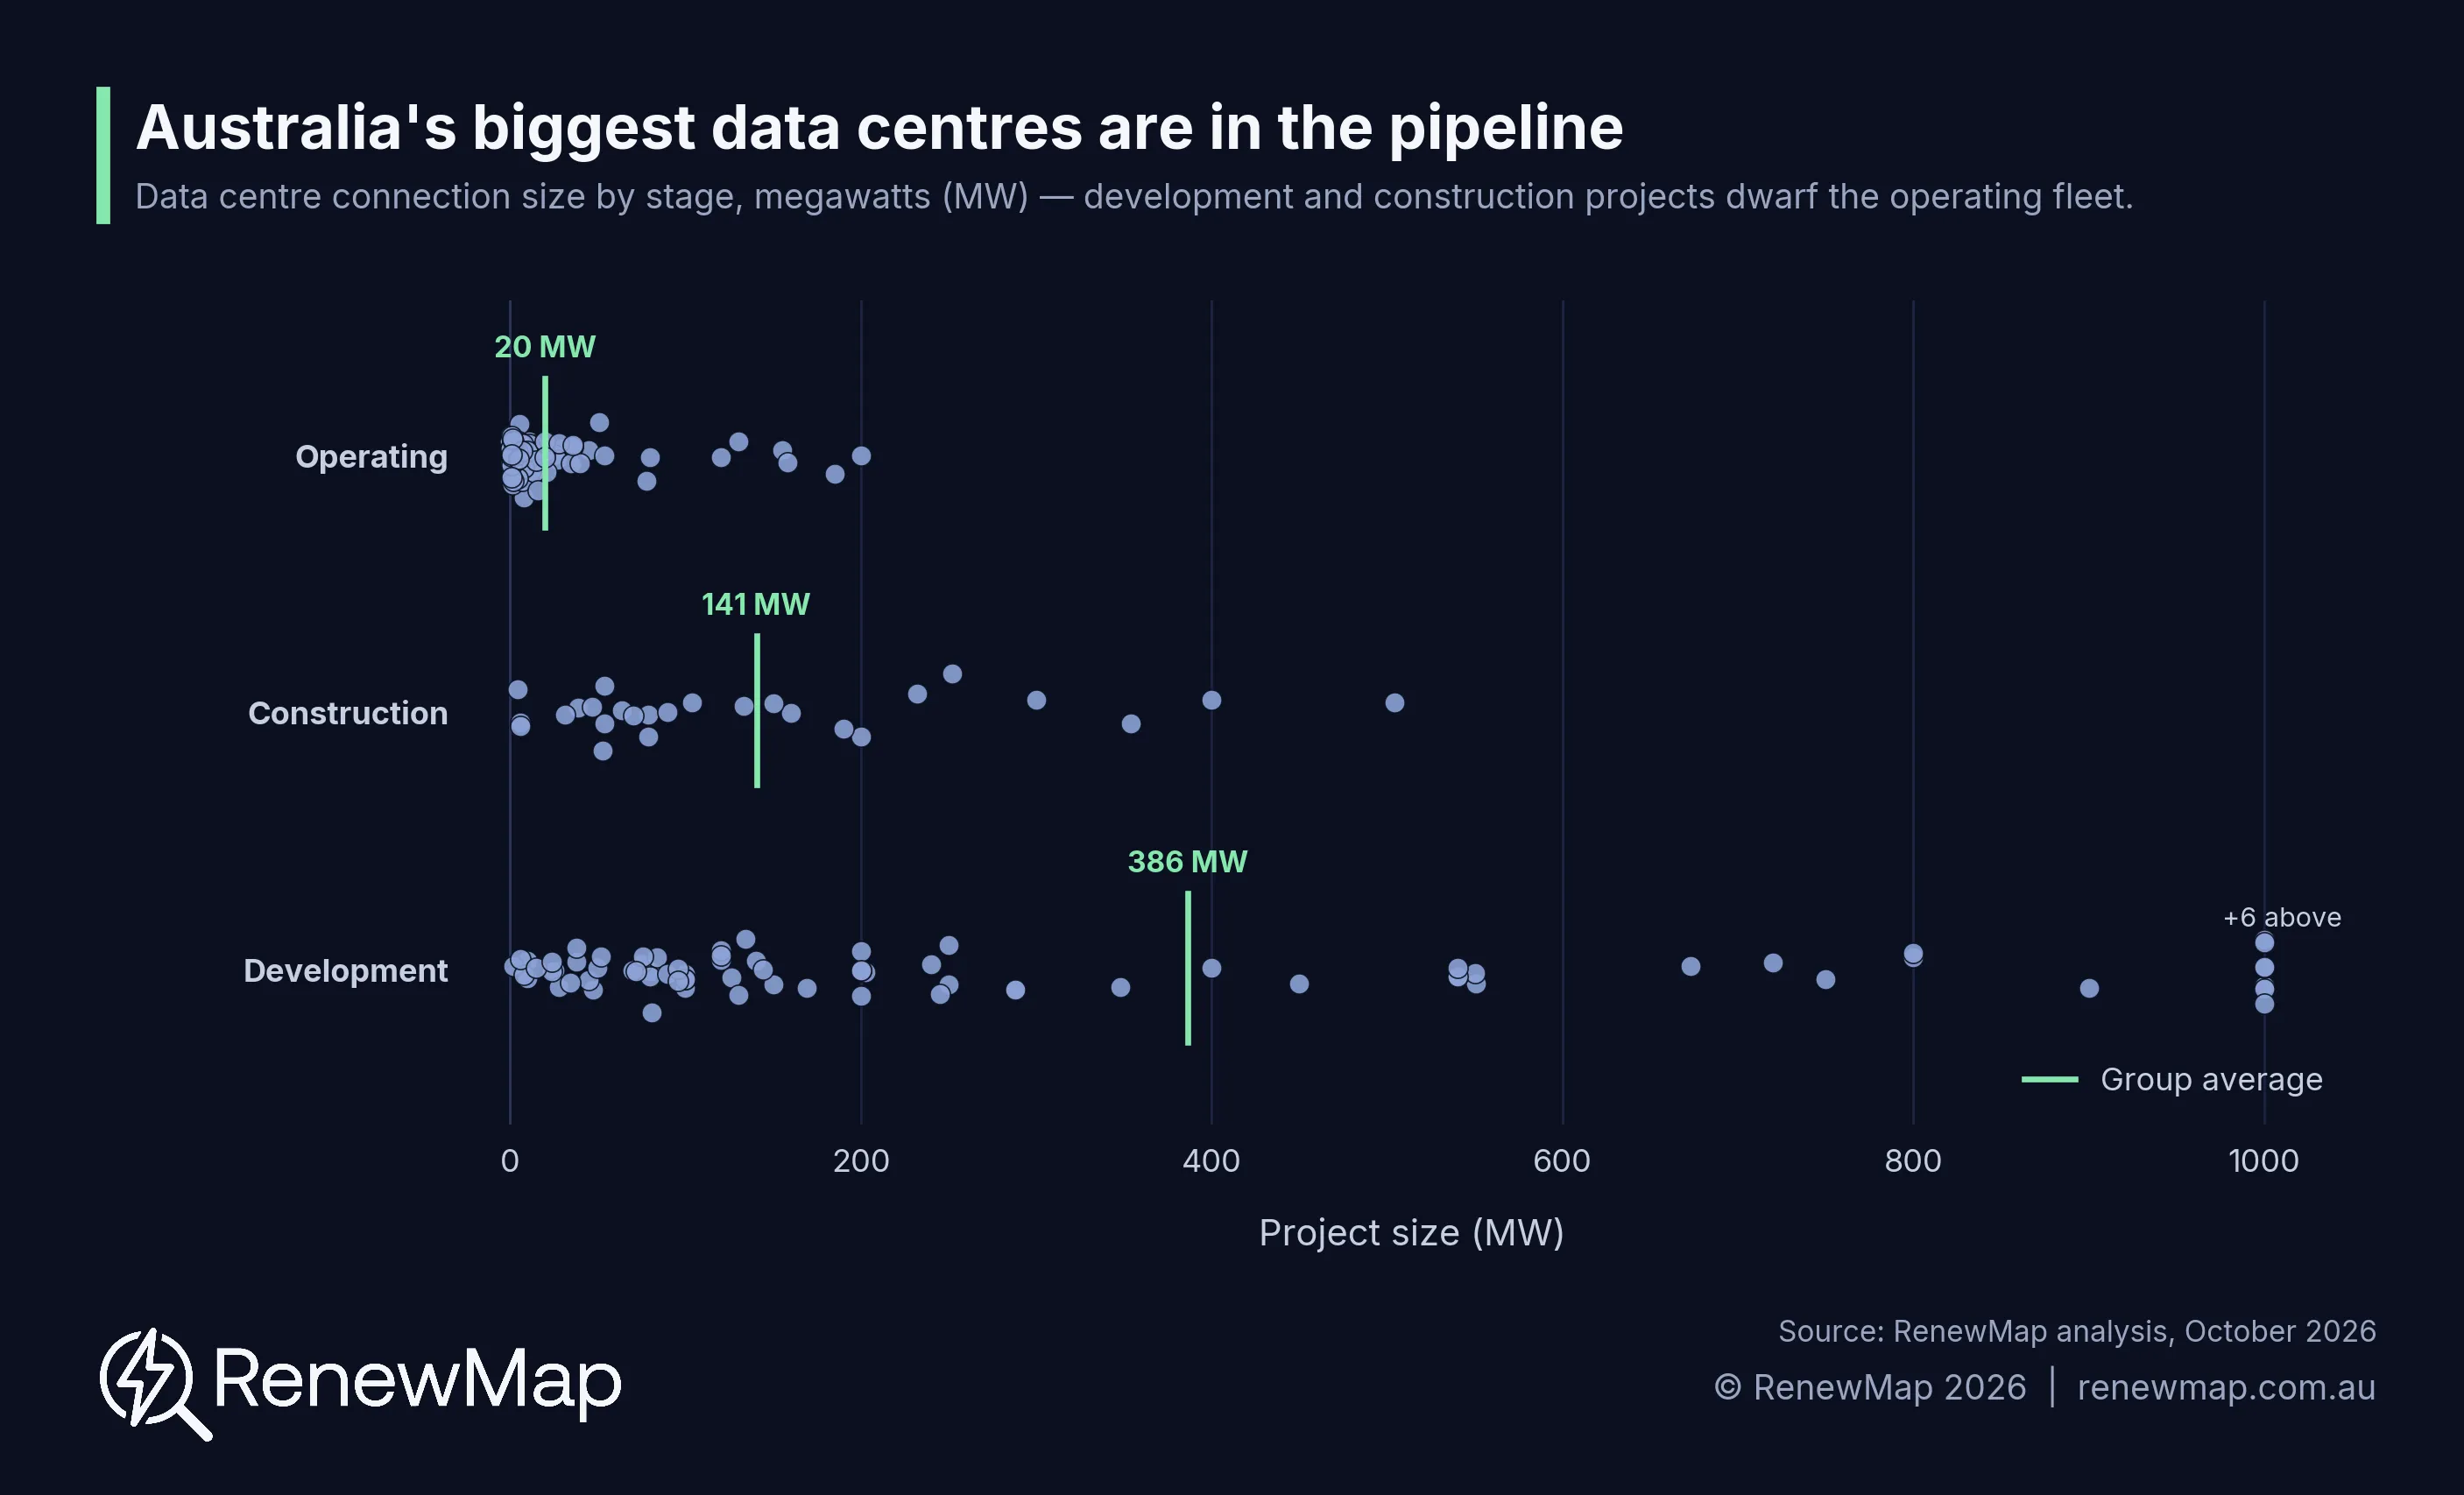
A small 10 MW facility can fit into the existing grid without much fuss. A development-stage campus in the many hundreds of megawatts or gigawatt scale needs its own generation, which is why so much of the current energy debate centres on new large loads. The Clean Energy Investor Group's latest Clean Energy Outlook report found 92% of investors expect data centres to be positive for clean energy investment. The federal government's new data centre standards and regulatory reforms point the same way: new large loads will be required to bring new firmed renewable energy to supply their massive energy consumption needs.
Most of the development pipeline is pre-planning
Of the capacity in development, only about 2.4 GW across 20 projects has planning approvals in place. Around 9.8 GW across 31 projects is currently under assessment, and roughly 19 GW across 29 projects has not been submitted for approval at all. By megawatts, more than half of the proposed capacity has not yet reached a planning department. Another caveat, a number of early stage projects have not yet published a connection size, so if anything the real total is understated.
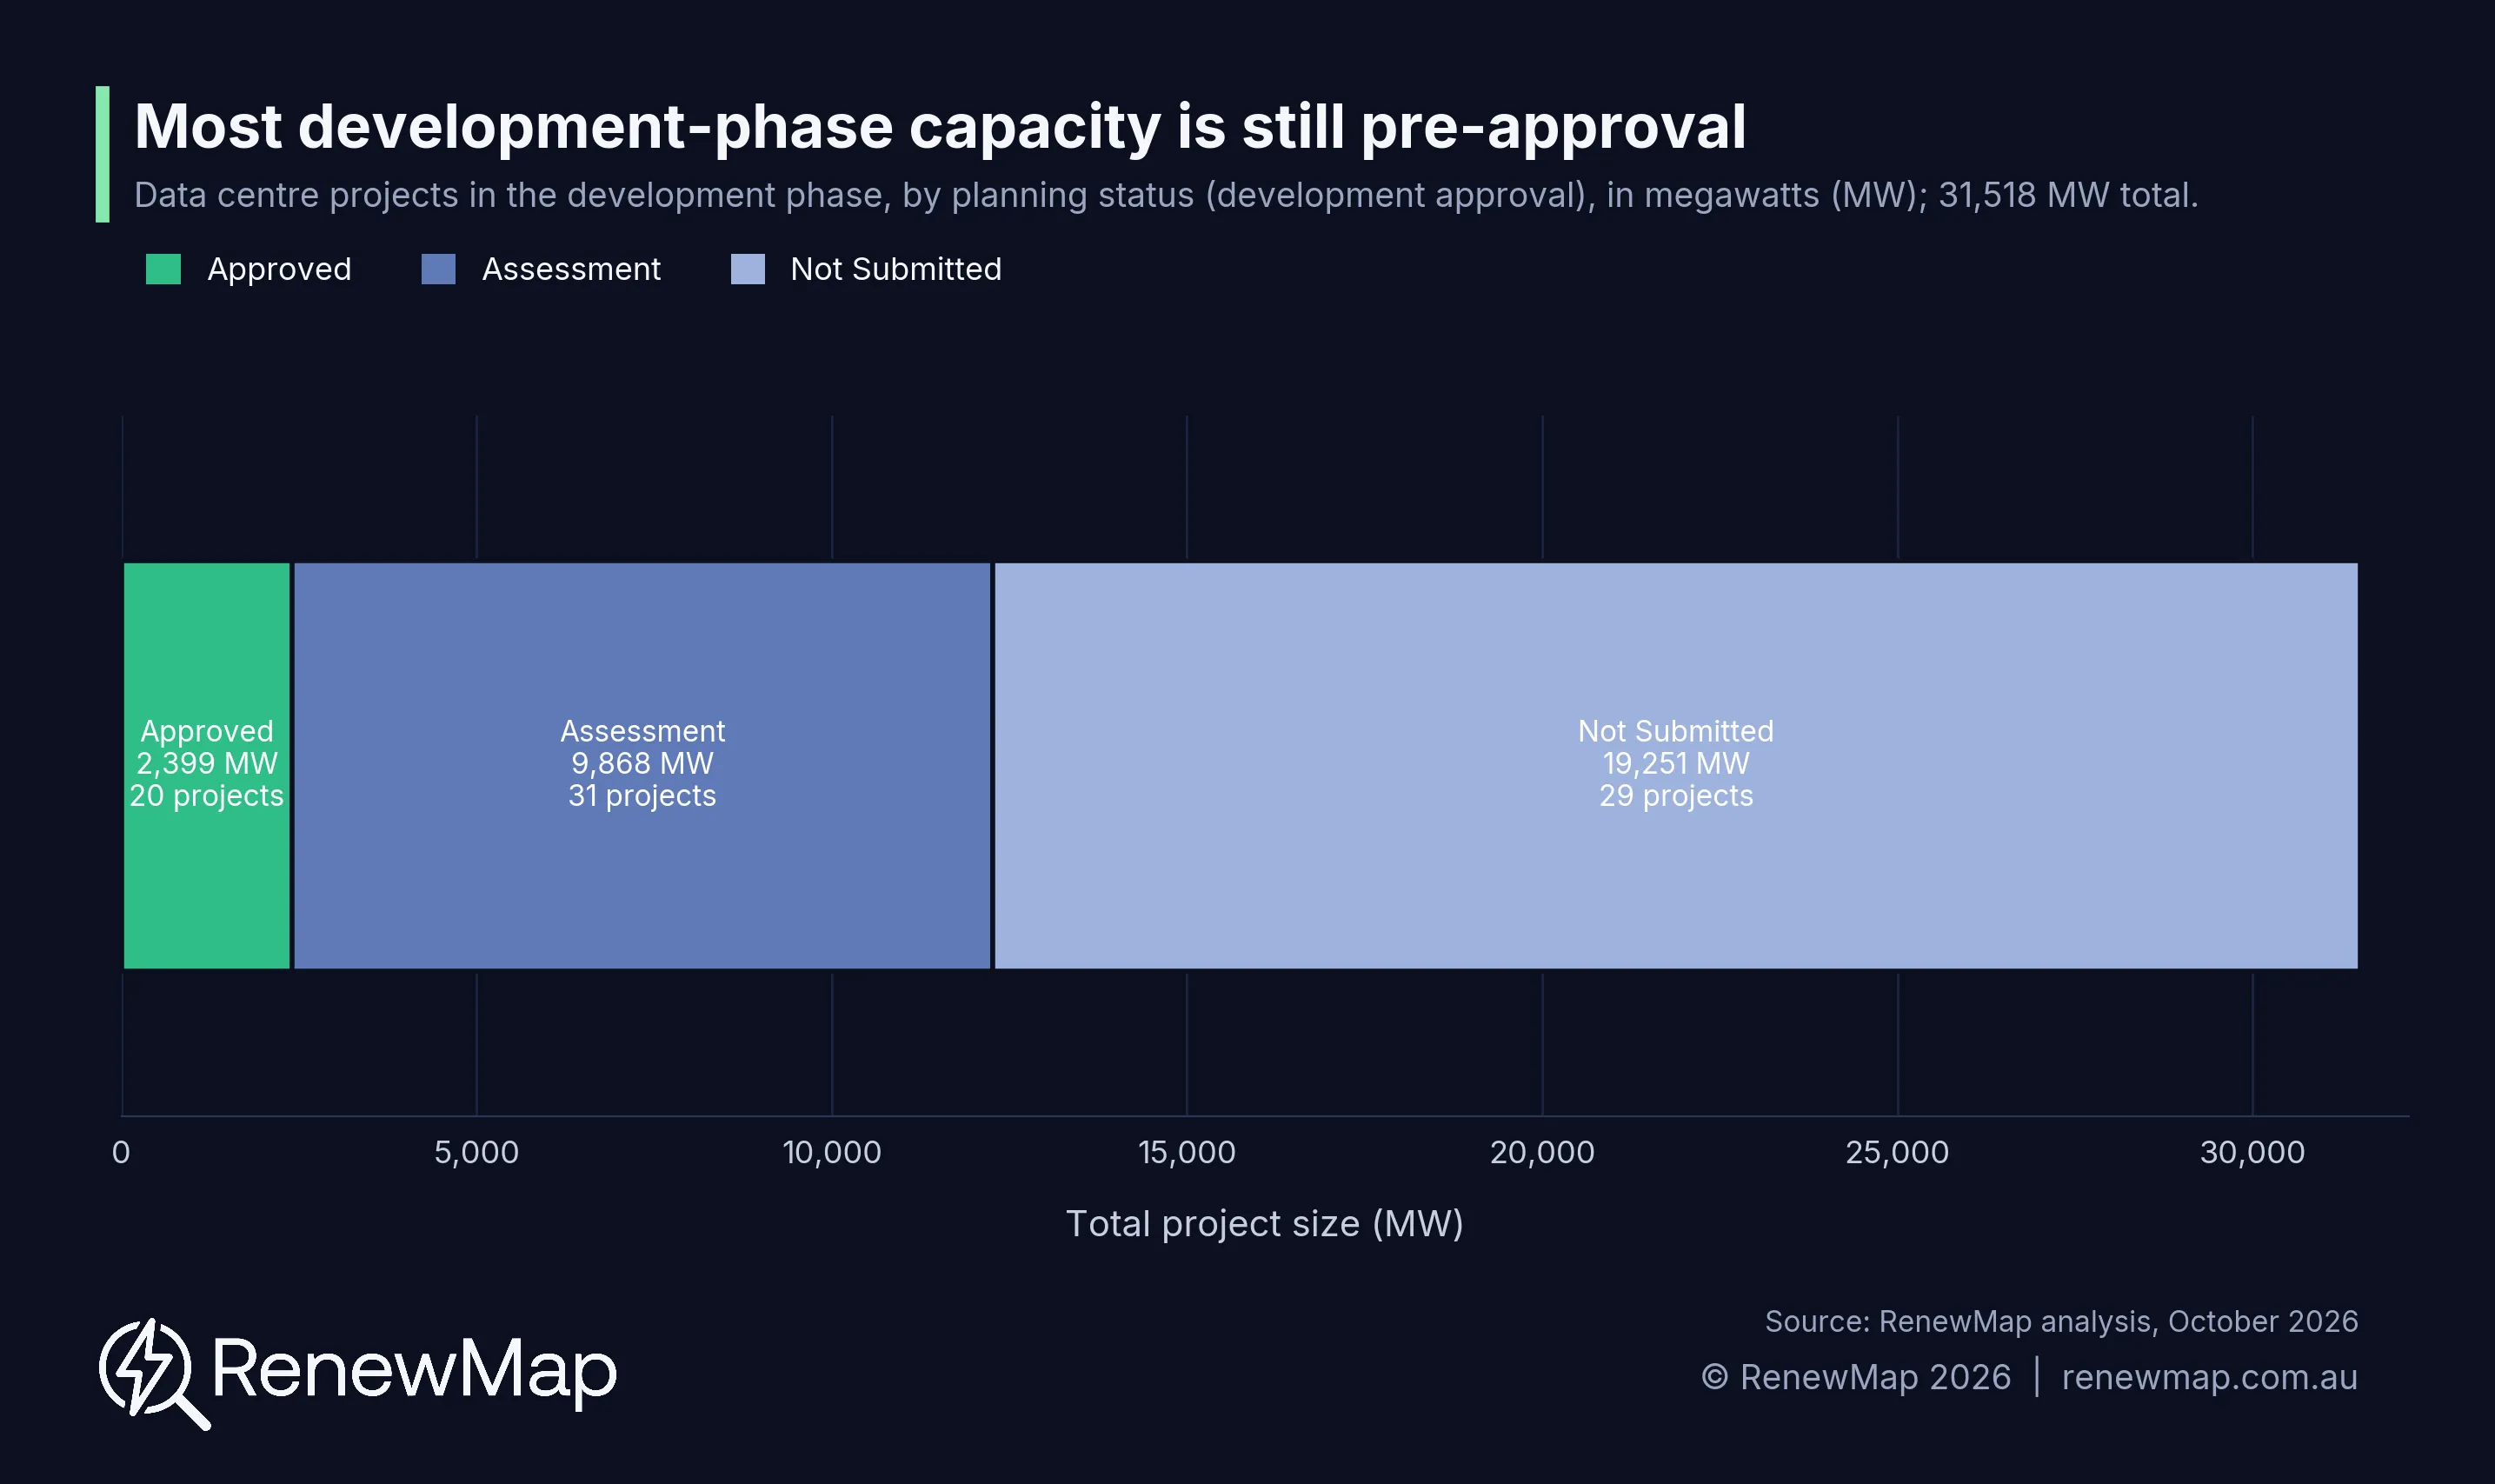
These are projects with capital committed to progressing through planning, so the pipeline is real, but the majority of it is in early stages. Plans also change, in the 2026 Electricity Statement of Opportunities (ESOO), Australian Energy Market Operator (AEMO) stated that 36% of the data centre projects in its 2025 pipeline were later cancelled, some with connections already in place. What we can take from this is that whilst there is a lot of activity and a huge pipeline of projects, not all of these will get built.
The data centre pipeline is heading regional
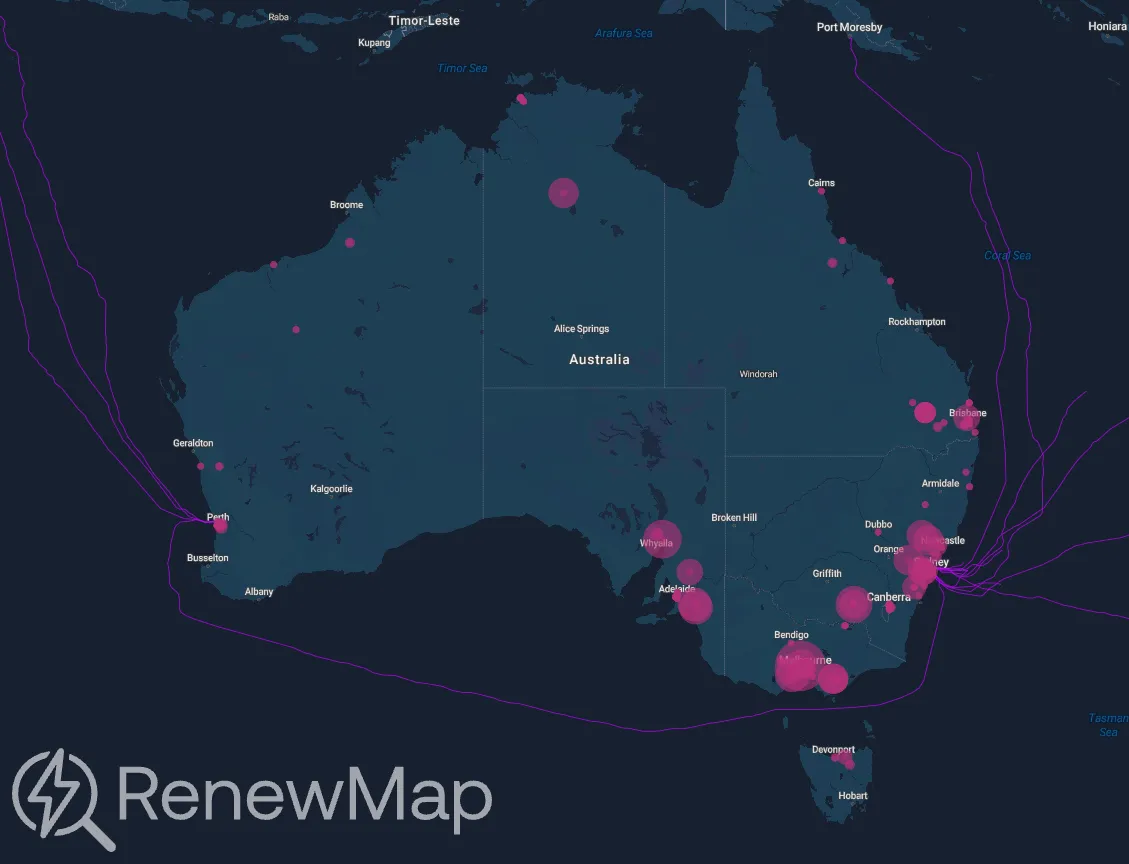
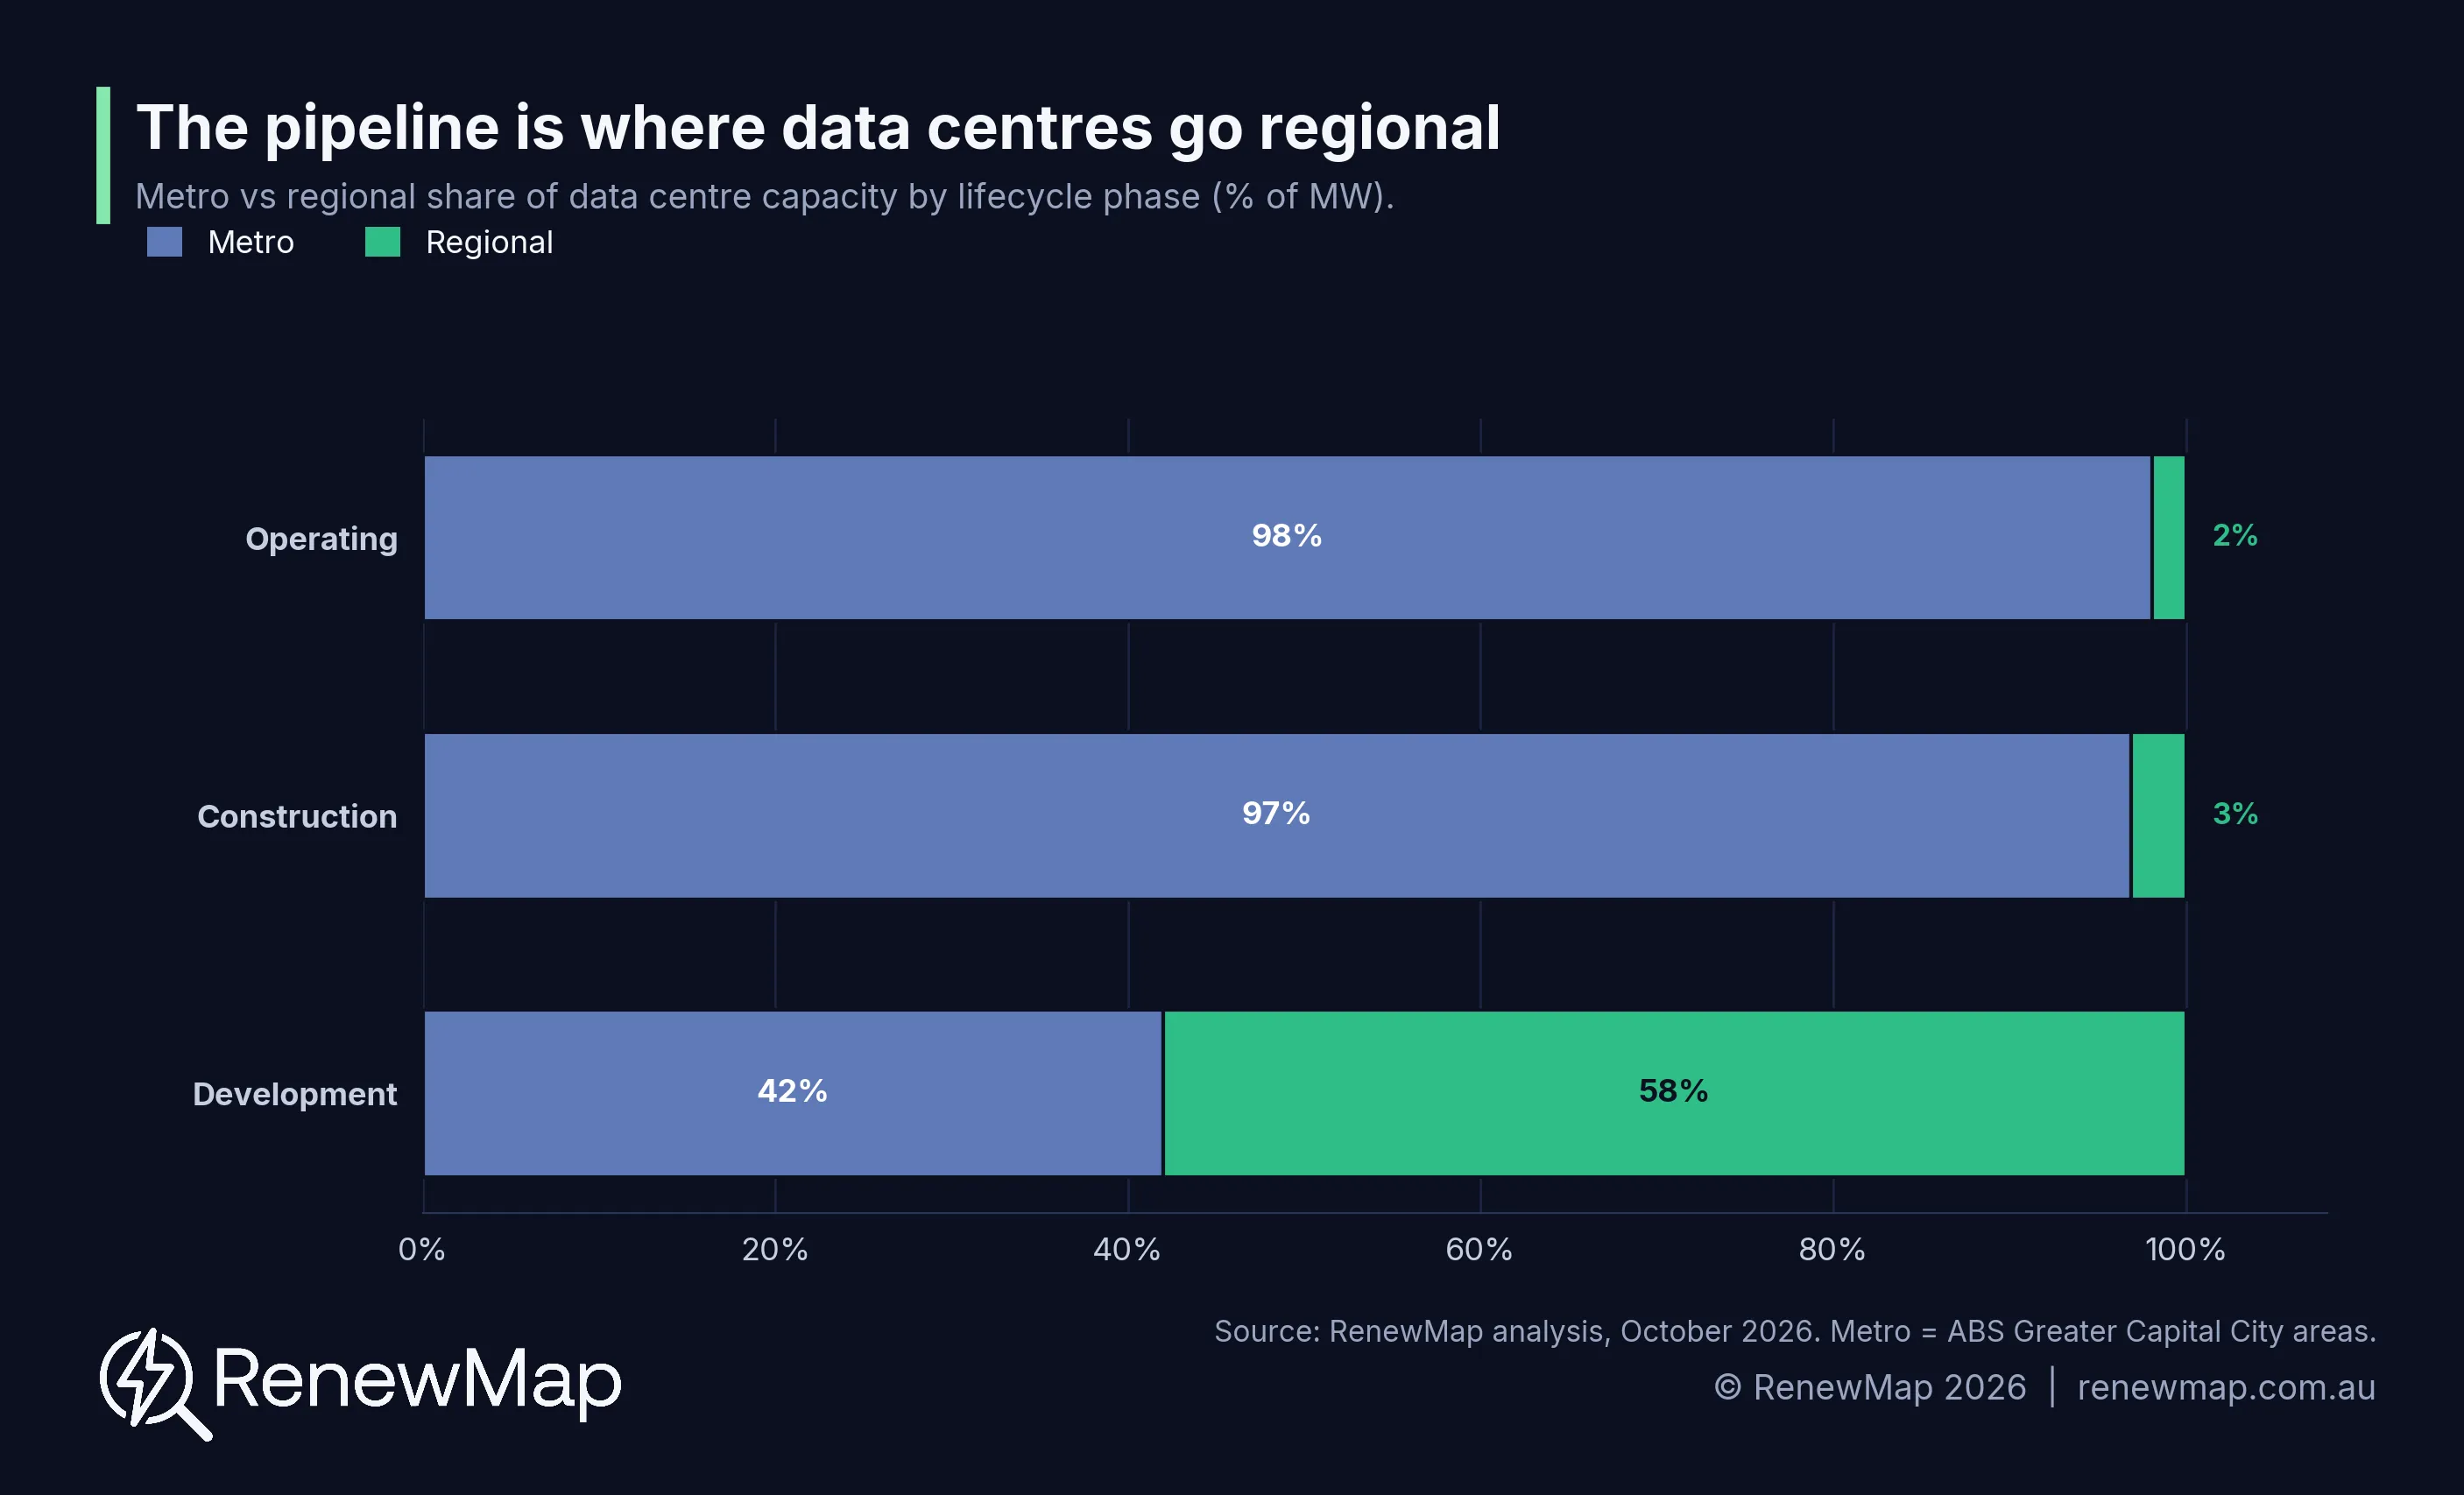
Another critical trend we've been following is the shift of large data centres from metro areas in Sydney and Melbourne, to regional locations. Virtually no regional data centre capacity is operating or under construction today, but the regions now hold the majority of the development pipeline.
So what's driving the regional shift? Today's data centres had to be near people, with low latency. What's being proposed are data centres running large-scale AI training and inference workloads. The projects are power-hungry, but have less requirements for low latency, so developers are chasing sites in regional areas, where land and grid capacity are more available. Much of the regional pipeline is also positioning in brownfield sites, like former coal regions or industrial areas where large grid connections already exist, or in declared Renewable Energy Zones.
Measured by capacity, 98% of operating data centres and 97% of those under construction sit in metropolitan areas. In the development pipeline, that flips: 58% of proposed capacity is regional.
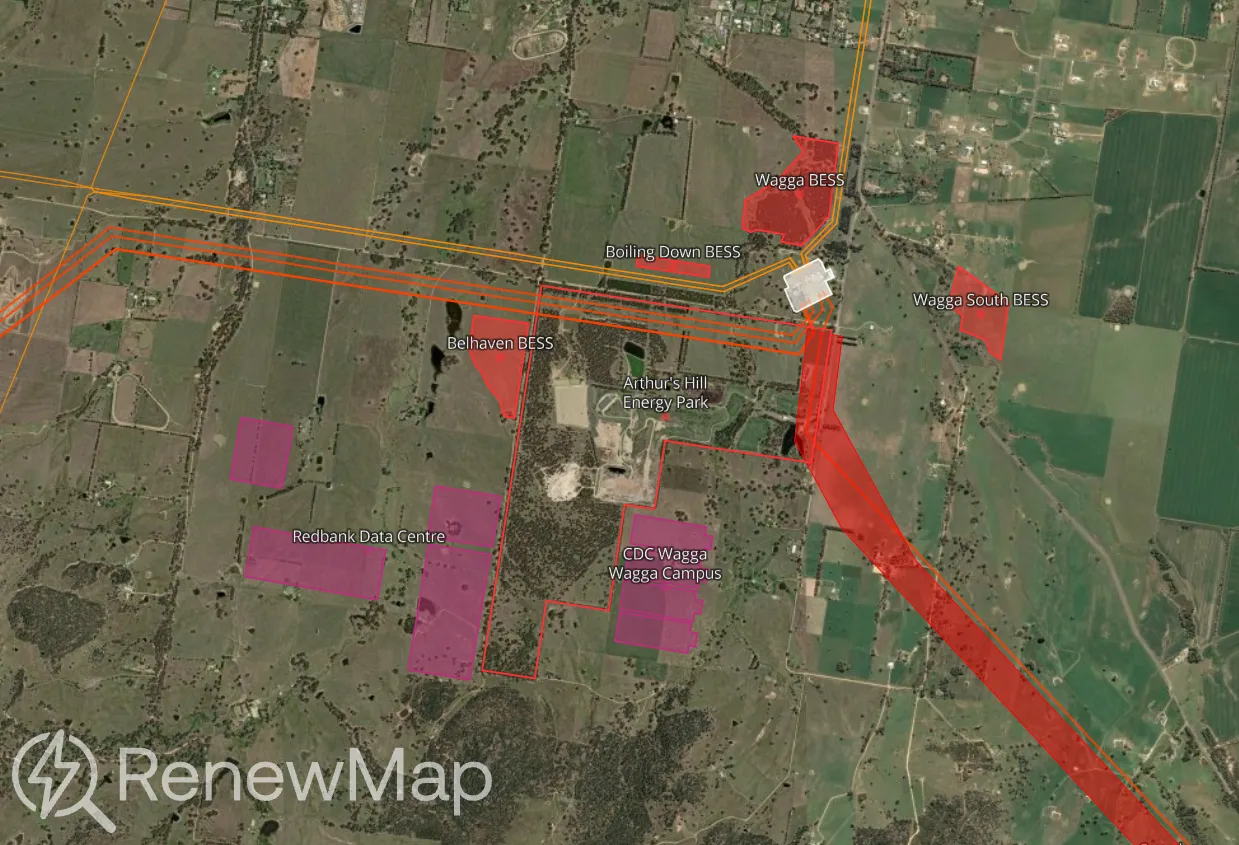
The regional examples are concrete, and many are already in our data. CDC's Wagga Wagga campus in regional NSW (1,400 MW) is one of the largest single projects we track. Alongside IREN's recently announced Redbank Data Centre (900MW), an additional 1.4GW of new battery developments and the new 500KV HumeLink transmission line, this small region on the southern outskirts of Wagga Wagga is becoming a hotbed of development.
However, recent media attention and community push back has placed increased scrutiny on large data centre projects. Developers are looking to earn social licence from host communities, in the same way wind, solar and BESS developers already do. We've already seen recent media announcements on the sheer scale of community benefit proposed (CDC up to $225 million and IREN greater than $200m going to the local council over 30 years for these two projects near Wagga Wagga).
We're seeing similar large scale projects proposed across a number of other states and territories:
- In Victoria's Latrobe Valley, EnergyAustralia's Yallourn 1 and 2 (1,000 MW each) and Keppel's Morwell (720 MW) are landing on the site of a retiring coal region.
- In the New South Wales Hunter region, there is the Hunter Valley AI Training Campus (1,000 MW) and the Mayfield Energy Precinct at Newcastle (1,000 MW). Wallerawang near Lithgow (1,000 MW) is another former coal-power site.
- In Queensland, Zerra DC's Western Downs Digital Park near Chinchilla in Queensland runs up to 2,160 MW across four stages, with Anthropic already signing a long term lease for running AI inference workloads answering user queries.
- South Australia there is IREN's Bundey Data Centre Campus (800 MW) and the Aurora Energy Precinct (200 MW). Several are co-developed by parties you would not have associated with data centres a few years ago, including mining companies, battery developers and independent power producers, and most have not yet lodged a development application.
- Project Ares and the Beetaloo Digital Data Centre are pushing into genuinely remote parts of the Northern Territory
Development approval timeframes vary greatly, state-by-state
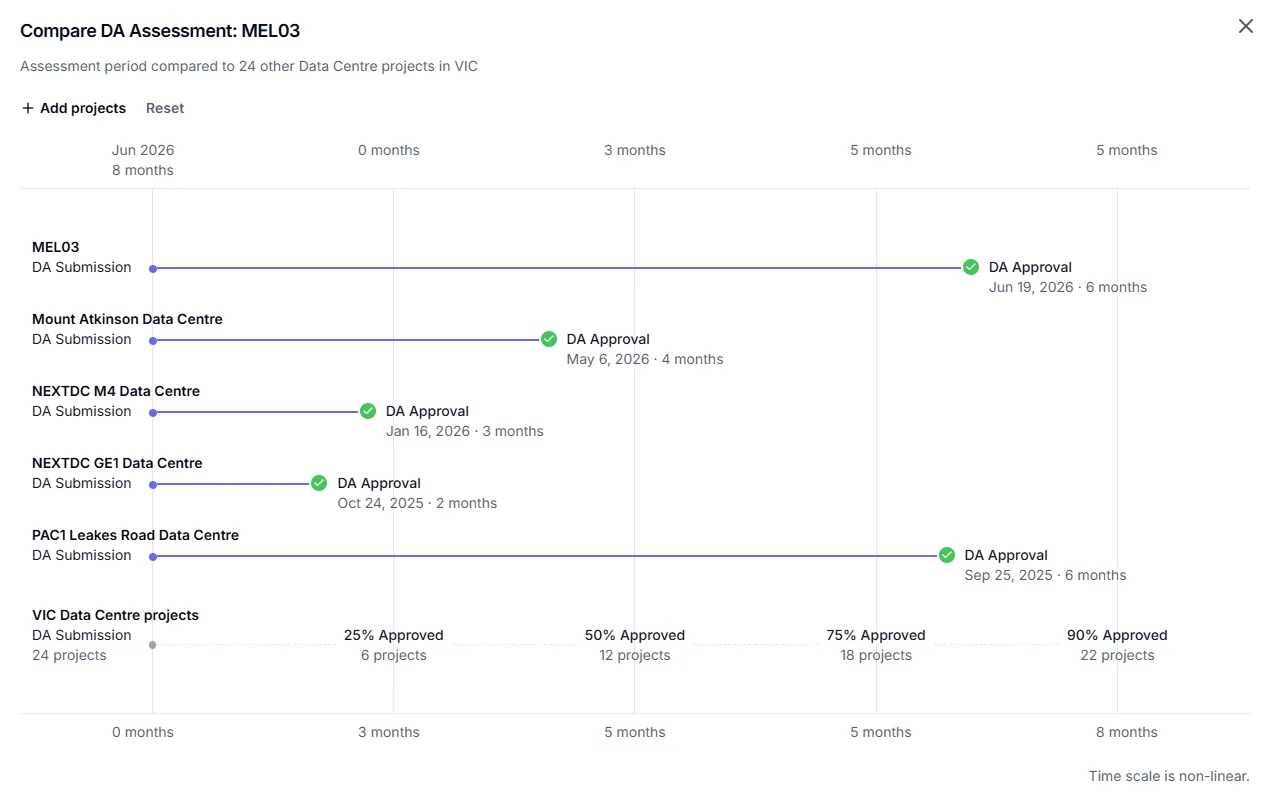
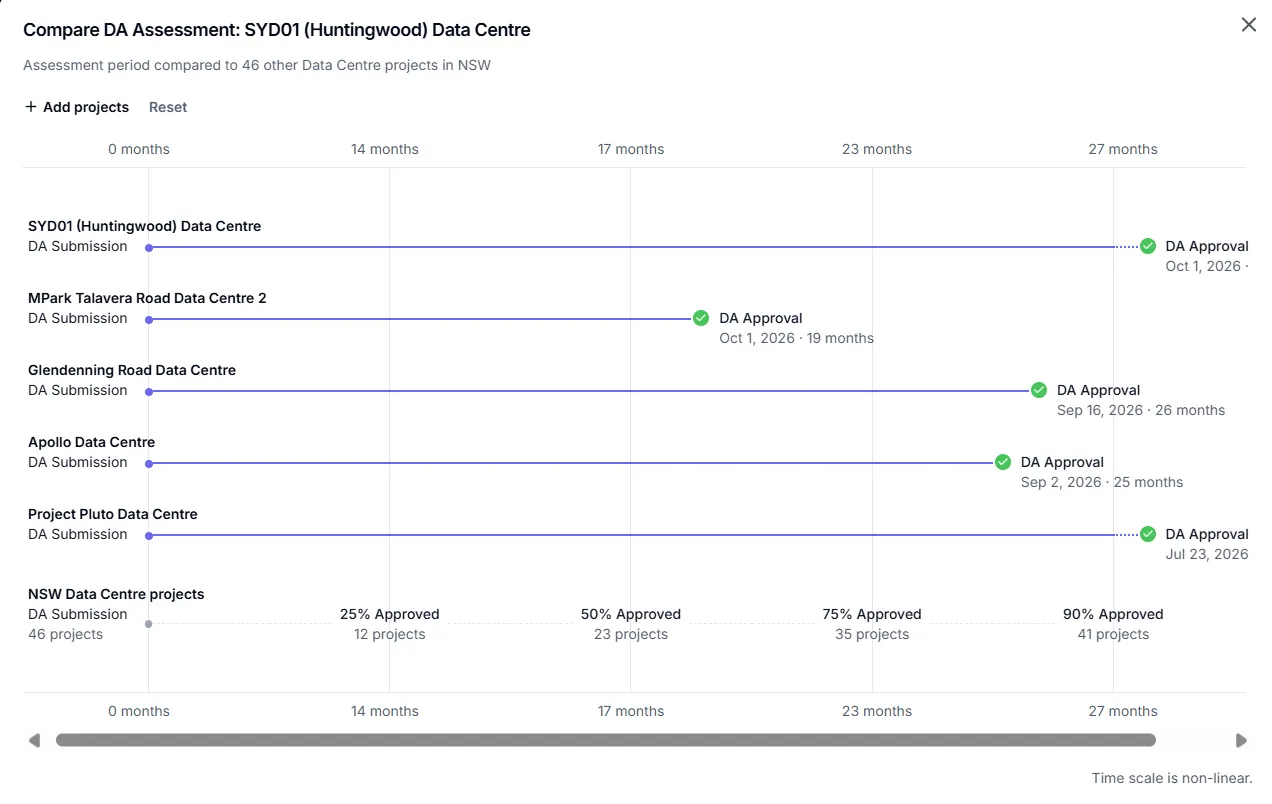
One interesting aspect we're tracking in the data is how long approval takes across different states and assessment pathways. As an example, a data centre planning application in New South Wales takes on average about nineteen months to be approved. Compared to Victoria, where it takes about five months on average. That gap is already shaping where developers are choosing to site projects. More development applications were submitted in Victoria over the past six months than in any other state, and given the timeframes involved, the pipeline is starting to tilt toward Victoria. Speed to market is critical for these projects.
If we drill into the five most recently approved projects across these two states, Victorian planning approvals took anywhere from two to six months. By comparison, in New South Wales, the five most recent approvals took between nineteen months to more than two years.
Who are the key players getting projects built?
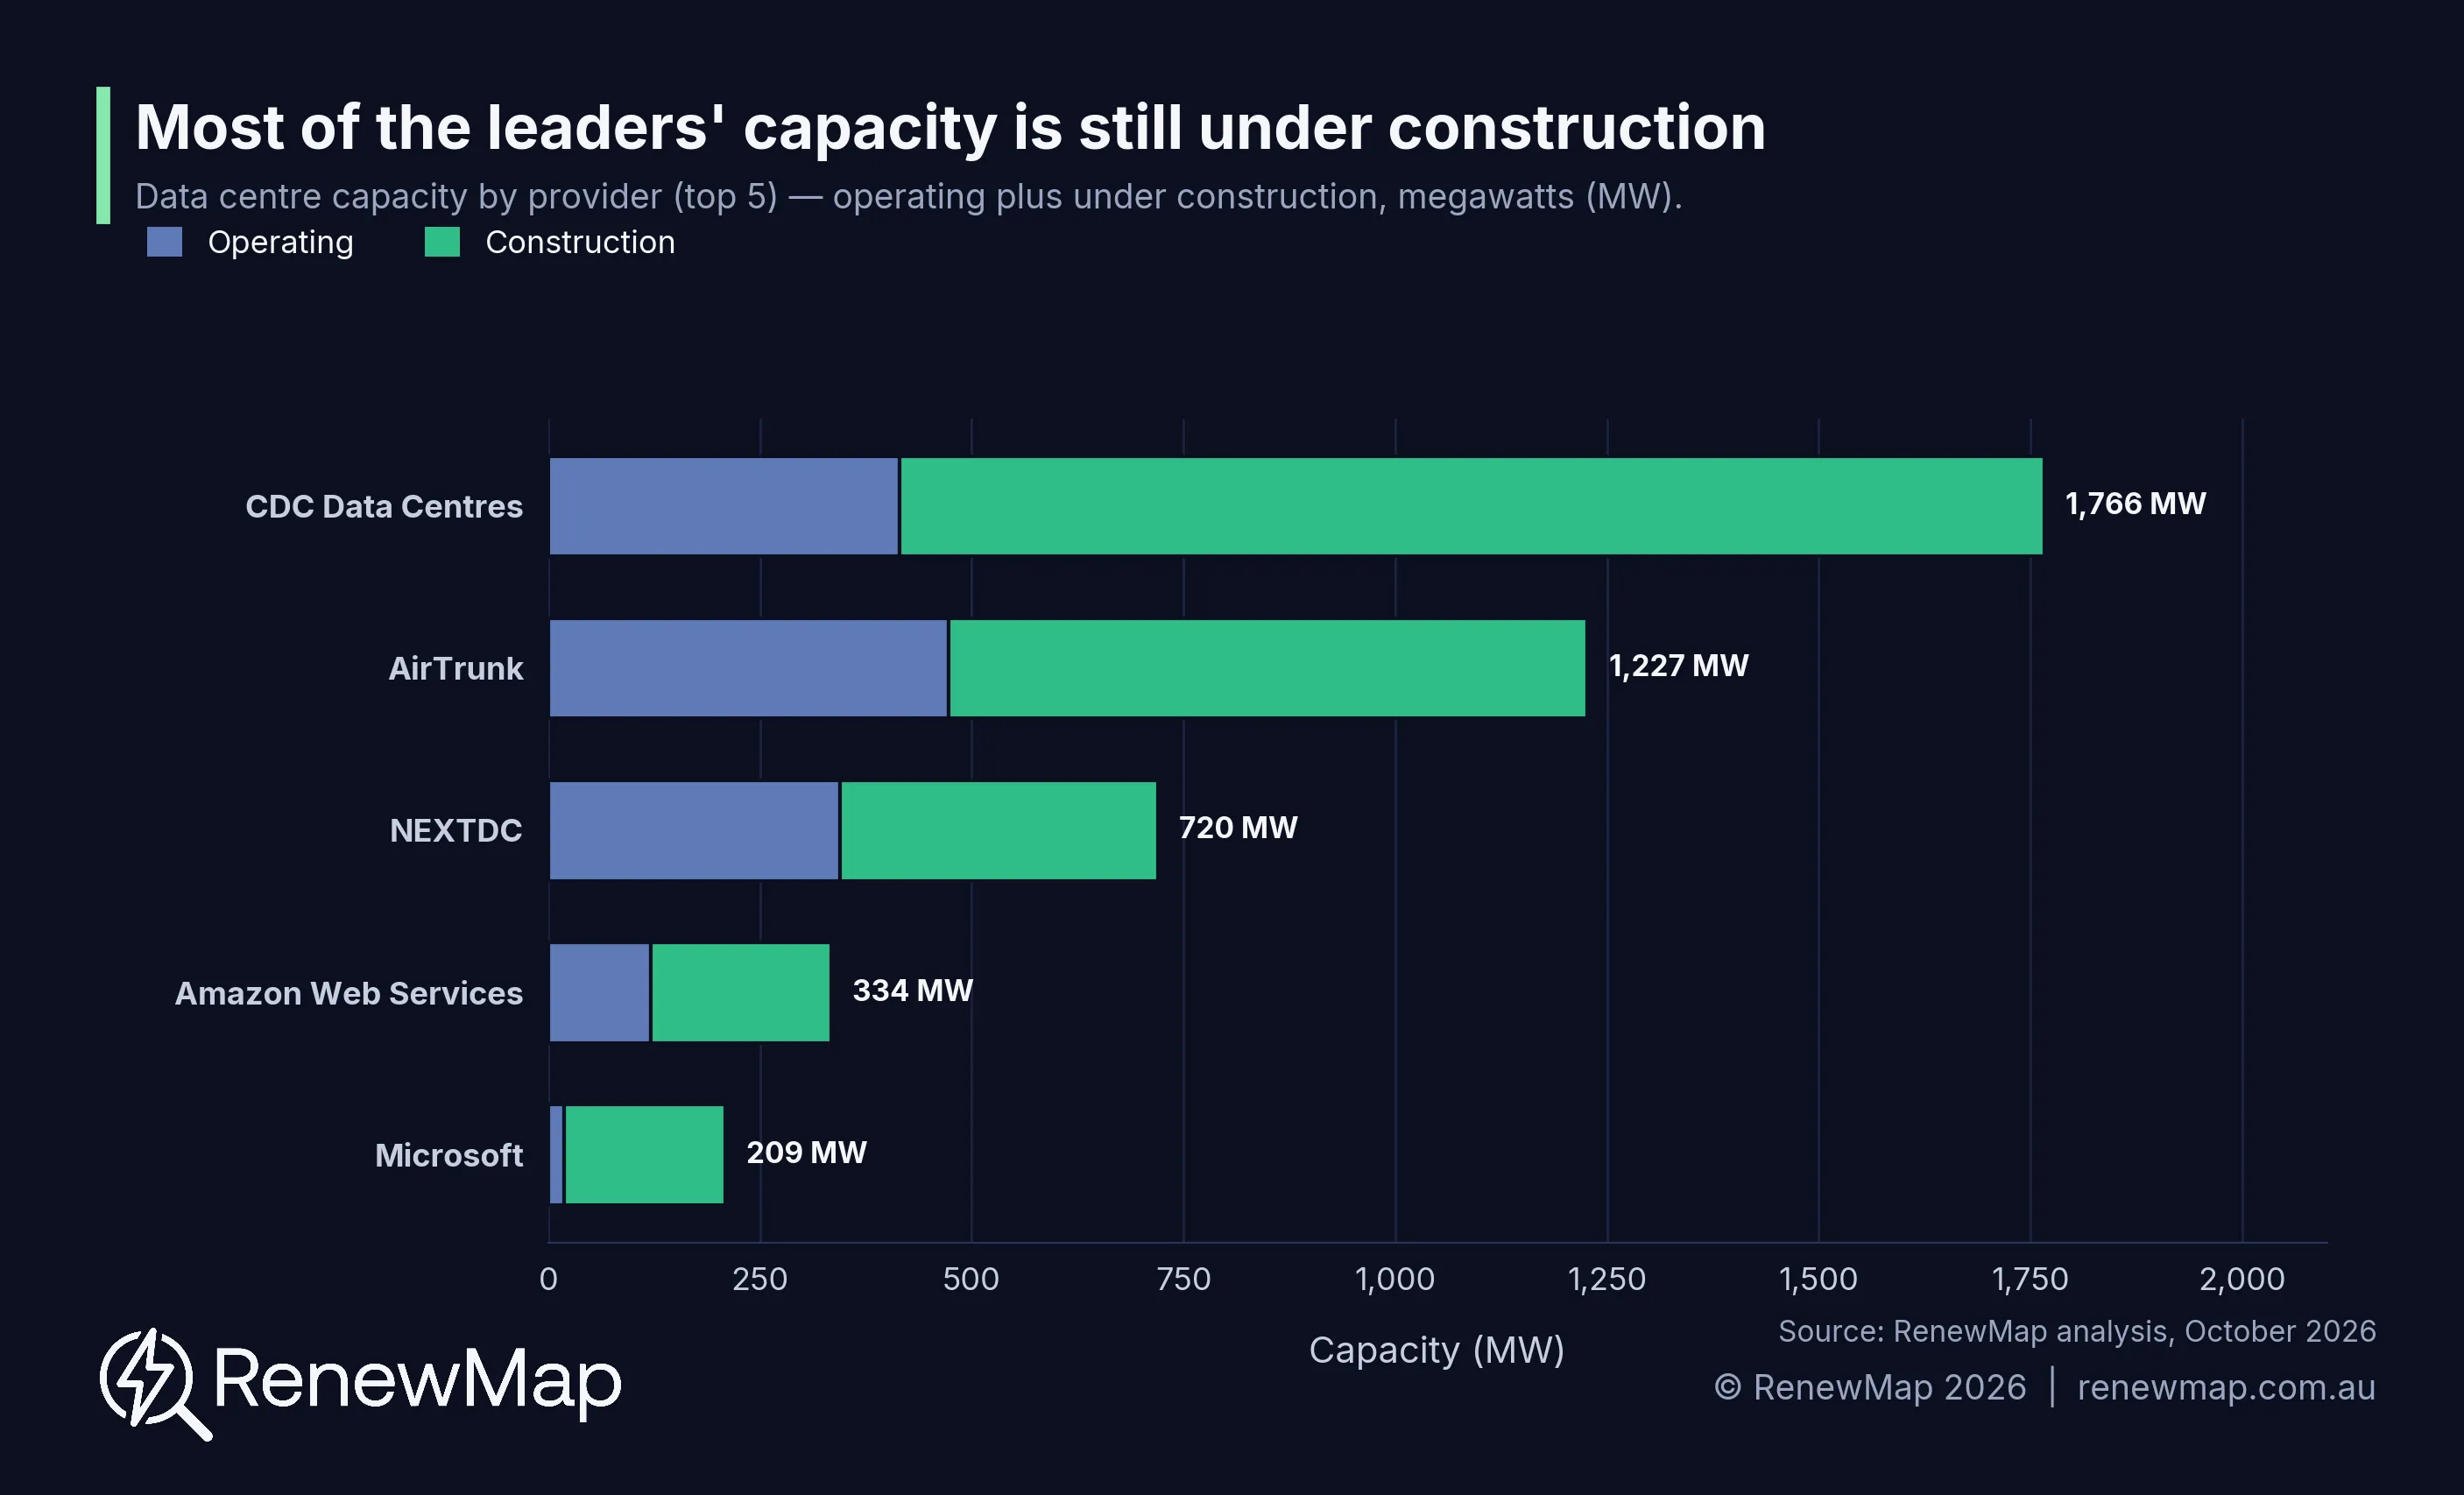
Capacity that is currently operating or under construction is concentrated among a few providers, led by CDC, AirTrunk and NEXTDC. For the leaders, most of that capacity is still under construction rather than live, so the jump in scale is being driven by a small number of players committing to large projects.
The development pipeline tells its own story, and the names leading it are not all traditional data centre operators. The familiar co-location players are there, with NEXTDC, CDC and Zerra DC all proposing large campuses. But they now sit alongside two newer groups. The first is the neocloud providers, AI compute specialists such as Firmus and IREN, several of them repurposed from crypto mining, chasing cheap power at scale. The second is the energy and infrastructure sector itself, with EnergyAustralia, Syncline Energy, Malabar Resources, Greenspot and others developing projects directly. It is a signal that the next wave of capacity is being shaped as much by power and land as by compute infrastructure.
What to take from it?
A few findings stay constant across every cut of the data. The data centres being proposed are far larger than the ones already built and new capacity is increasingly following energy projects into the regions. The time taken to approve a data centre varies widely by state, taking more than 3 times as long for projects in New South Wales to get approved, compared to Victoria. How much of the capacity will get built? Most is not yet approved, some will fall away and the regional shift depends on grid capacity, fibre networks and workforce that is not yet in place. But more broadly, the shift will depend on projects being well received by regional communities and developers gaining social licence to develop in these areas.
We will keep tracking it project by project. RenewMap covers 4,500+ utility-scale energy projects and large loads across Australia and New Zealand, from early feasibility through to operations, across more than 100 data fields updated daily by our analysts in Australia.
If you want to explore the pipeline yourself, we've put together some free project trackers here:
Browse free RenewMap resources covering Australia and New Zealand's energy markets, including regional overviews and technology-specific guides for wind, solar, batteries and data centres.